


Bitcoin Price History: Breaking Down the Key Phases of Crypto’s Long-Term Evolution


Since its launch in 2009, Bitcoin has transformed from a niche cryptographic experiment into a global macro asset trading well above $80,000. Its journey has not been linear. Instead, Bitcoin’s price history is best understood as a sequence of structural phases shaped by technological milestones, speculative cycles, institutional adoption, and macroeconomic forces. Each phase introduced a new type of participant, new liquidity conditions, and a different risk profile.
Rather than simply tracking yearly highs and lows, examining Bitcoin’s long-term evolution reveals how the asset matured from a peer-to-peer experiment into a globally recognized store of value.
The Experimental Foundations (2009–2010)

Bitcoin’s earliest recorded trade occurred in late 2009, when 5,050 BTC were exchanged for $5.02, valuing each coin at $0.00099. At the time, Bitcoin had no formal exchange infrastructure and was primarily discussed among developers and cryptography enthusiasts on niche forums.
By July 2010, Bitcoin began trading more visibly at around $0.05 per coin. Liquidity remained thin, but price discovery had begun. Later that year, BTC climbed to $0.39, marking its first notable rally. Even so, the market remained highly illiquid and experimental. Price movements during this period reflected curiosity and early adoption rather than broad investment demand.
This era established the proof of concept. Bitcoin functioned, transactions cleared, and value could be exchanged without centralized intermediaries.
The First Speculative Cycle (2011–2013)
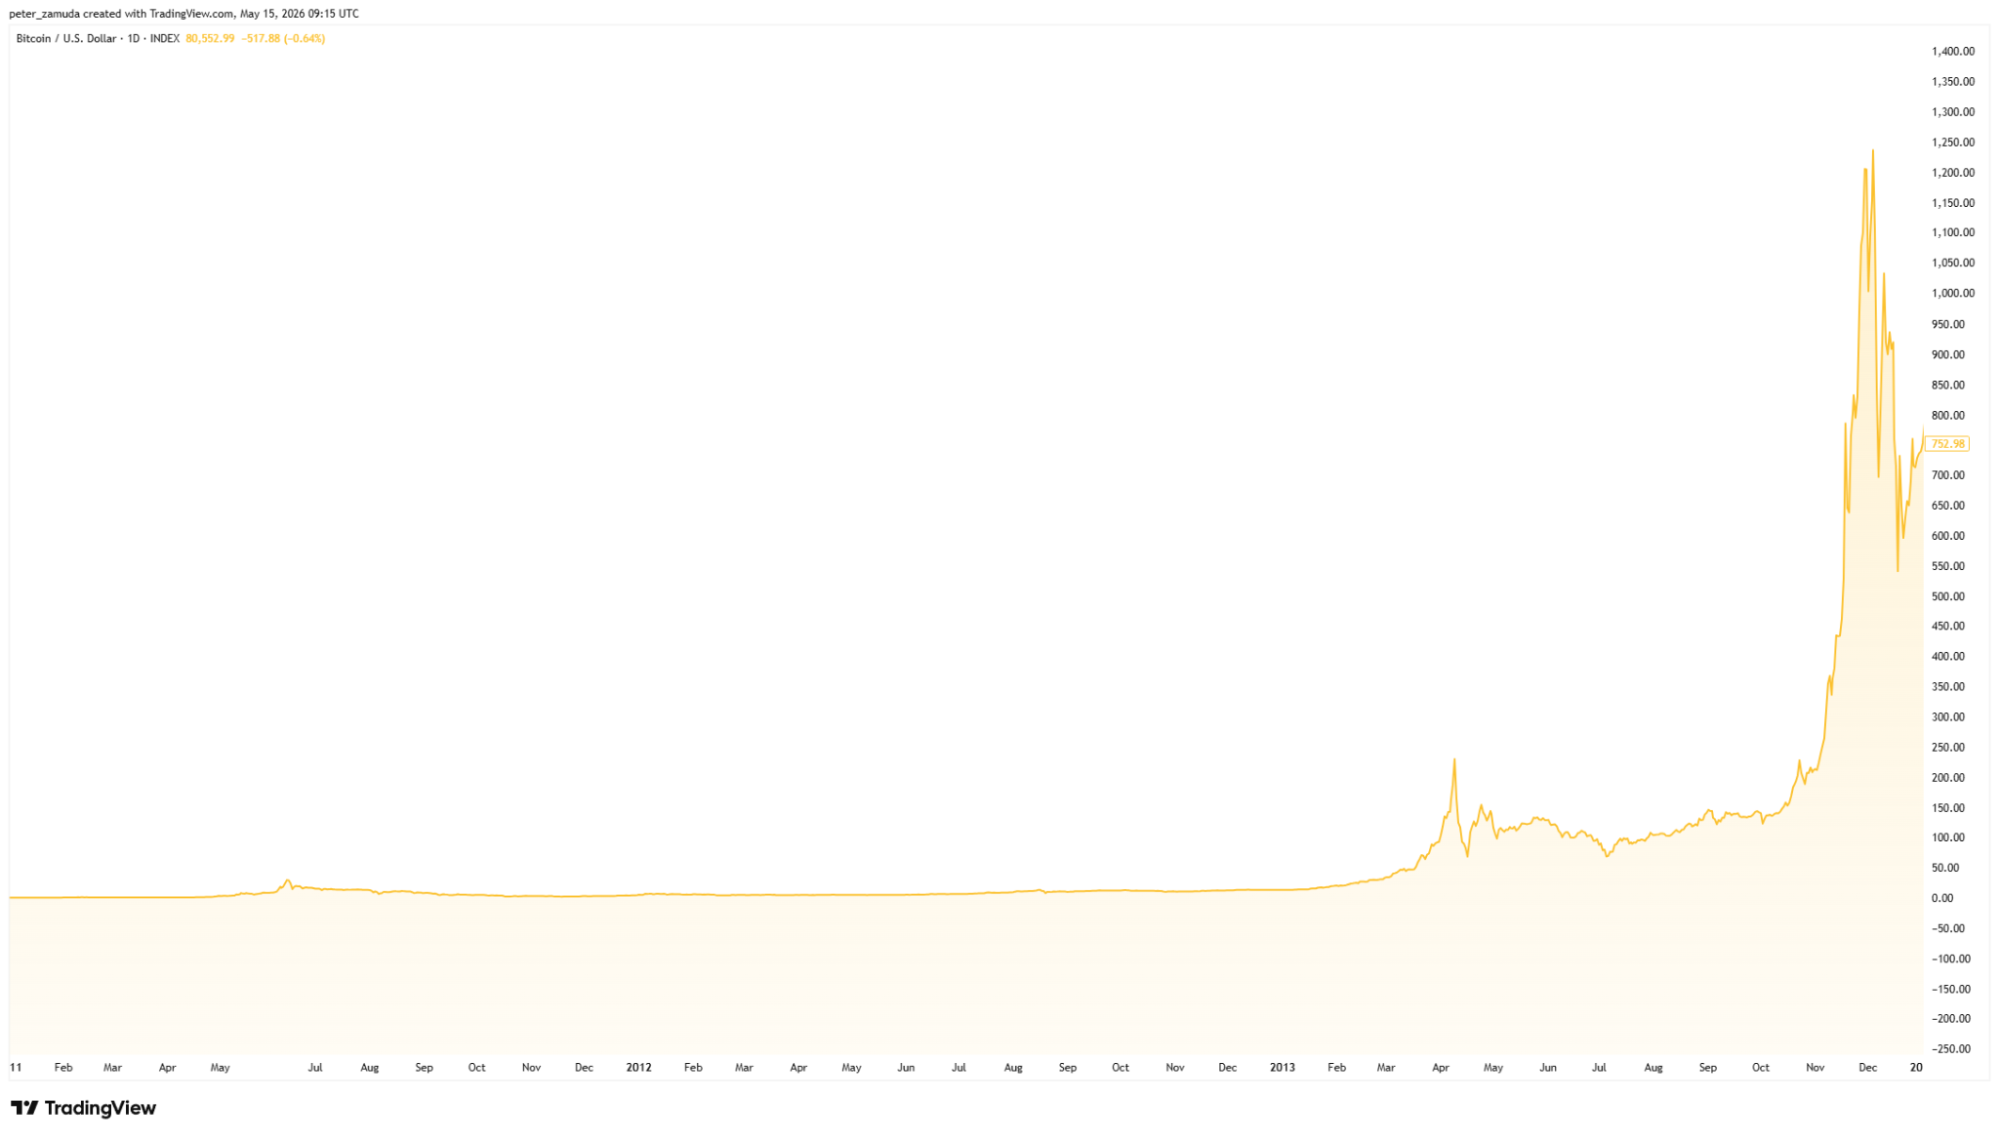
In 2011, Bitcoin entered its first true speculative expansion. The price surged from roughly $0.30 to nearly $30 in a matter of months, representing an increase of close to 10,000%. For the first time, Bitcoin attracted attention beyond technical communities. Payment processors began experimenting with BTC, and early adopters saw exponential returns.
The real structural shift occurred in 2013. Retail access expanded significantly as exchanges like Mt. Gox and Coinbase facilitated easier buying and selling. Bitcoin crossed $1,000 for the first time, peaking at $1,156 in December 2013. This rally was fueled by rapidly increasing media coverage, growing public awareness, and a surge in global liquidity entering the ecosystem.
However, this expansion also revealed structural fragility. The ecosystem was immature, security practices were inconsistent, and regulatory clarity was minimal. The crash that followed exposed these weaknesses.
Crisis, Correction, and Infrastructure Building (2014–2015)
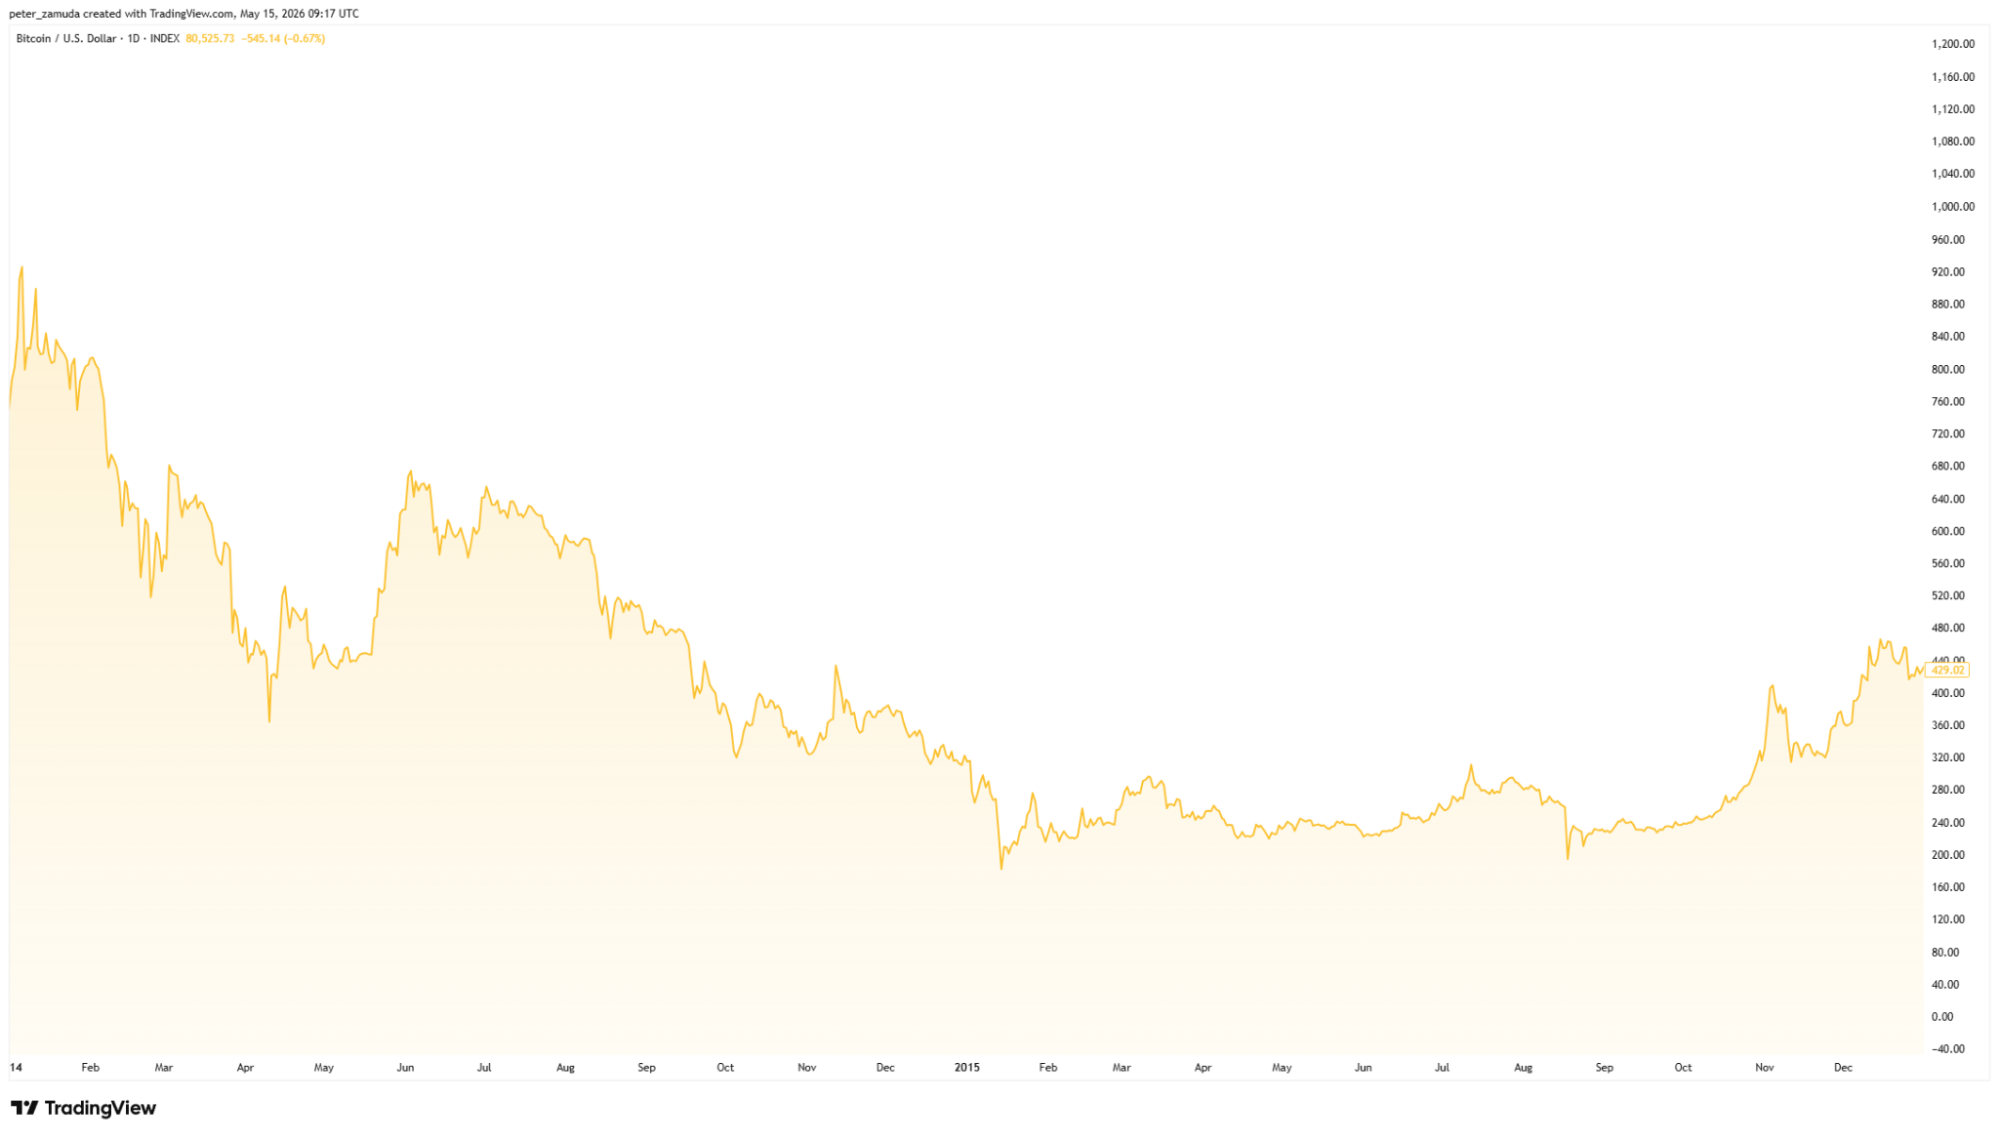
The collapse of Mt. Gox in 2014 marked one of the most significant events in Bitcoin’s history. Investor confidence eroded quickly, and BTC fell from around $1,000 to $218. The following two years formed a prolonged bear market defined by skepticism and capital flight.
Yet beneath the surface, infrastructure matured. Custody practices improved, new exchanges entered the market, regulatory frameworks began forming, and serious developers continued building. While price action appeared stagnant, the foundation for long-term institutional participation was quietly forming.
Bitcoin survived its first systemic crisis, reinforcing the durability of the network itself even as market participants rotated out.
The Institutional Awakening (2016–2017)
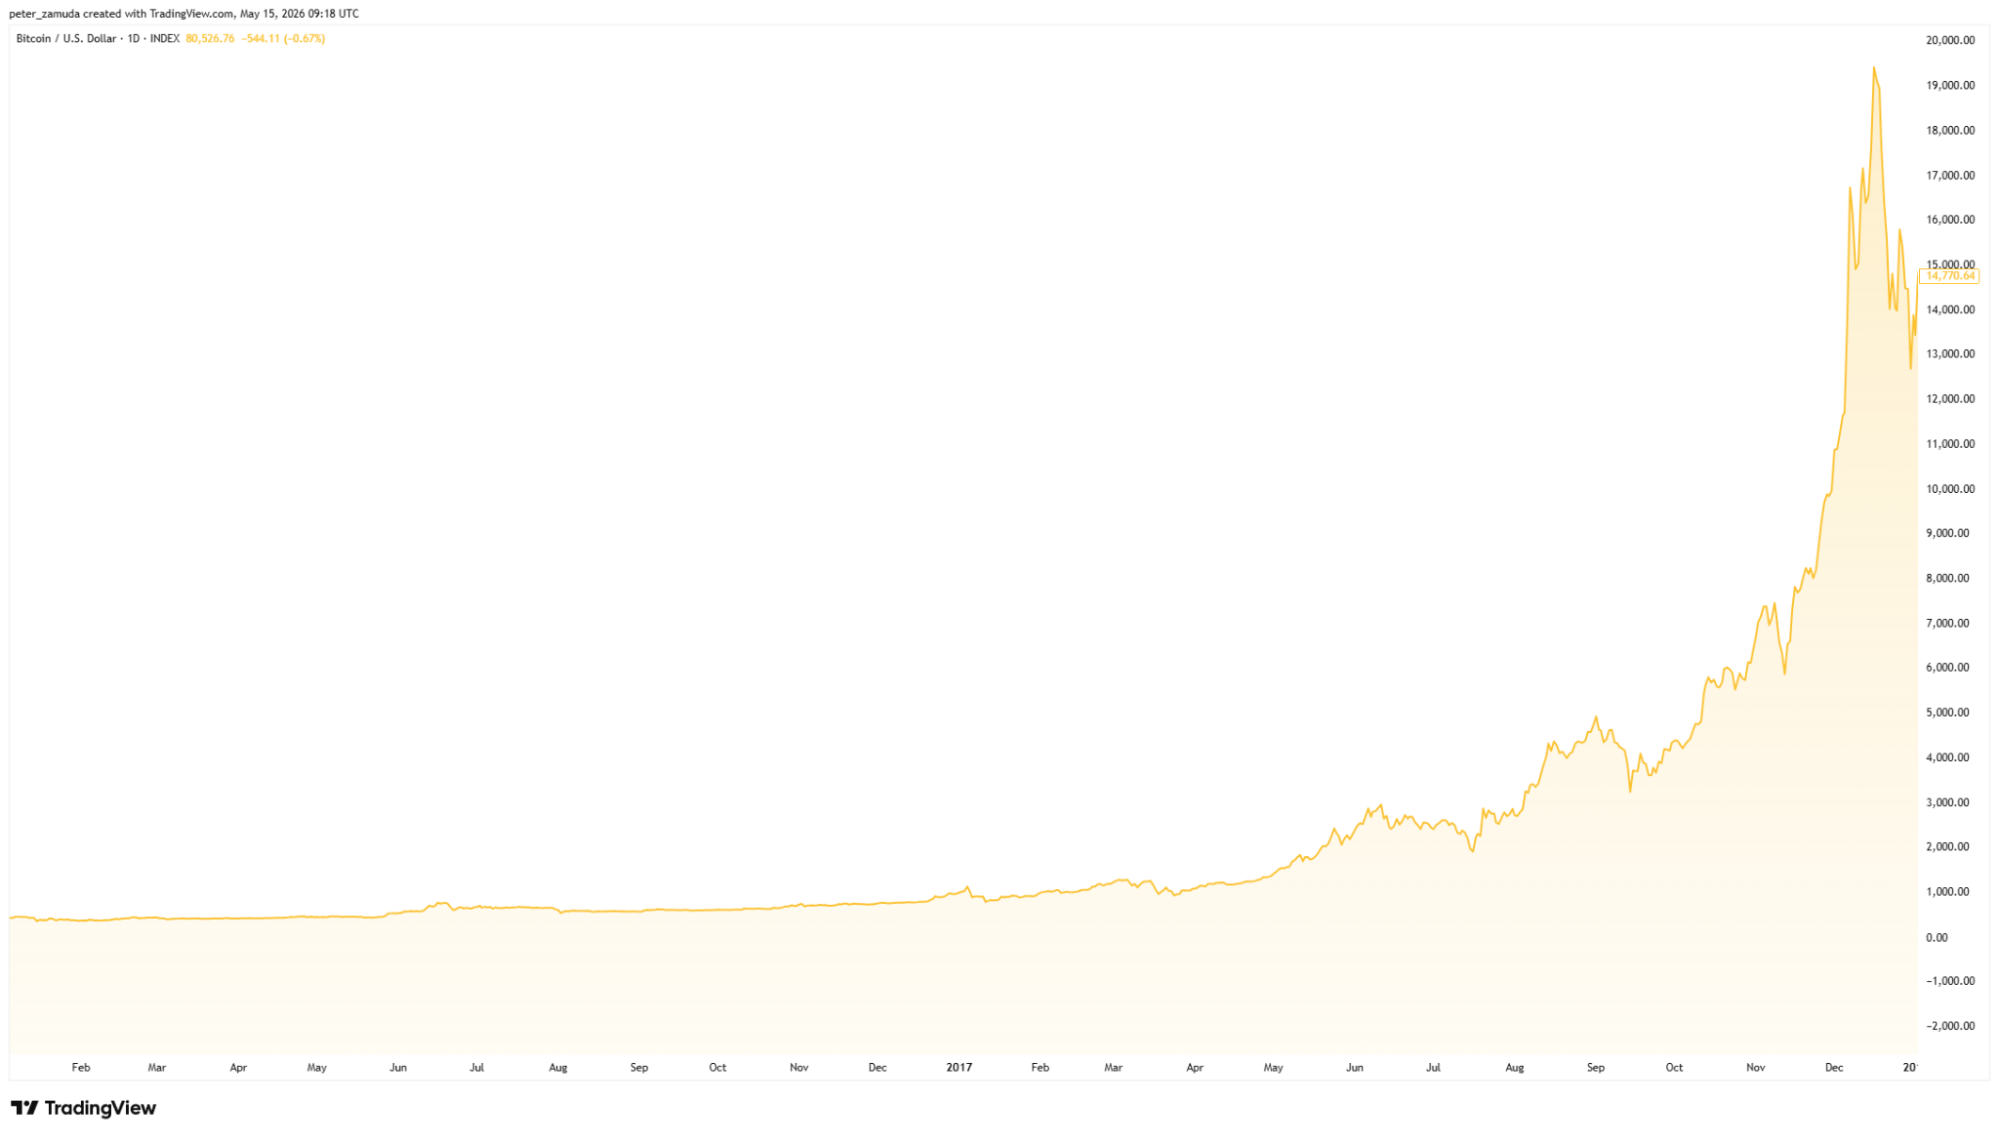
Between 2016 and 2017, Bitcoin experienced one of the most dramatic rallies in financial history. The price rose from approximately $430 to nearly $20,000 by late 2017. This cycle was driven not only by retail speculation but also by growing global legitimacy. Japan recognized Bitcoin as a legal payment method, financial institutions began researching blockchain technology, and futures markets launched in the United States.
This period also introduced the broader crypto market through the ICO boom. Capital flooded into digital assets, often indiscriminately. Bitcoin’s legitimacy expanded, but the rapid pace of speculation once again set the stage for a sharp correction.
From Retail Mania to Macro Asset (2018–2023)
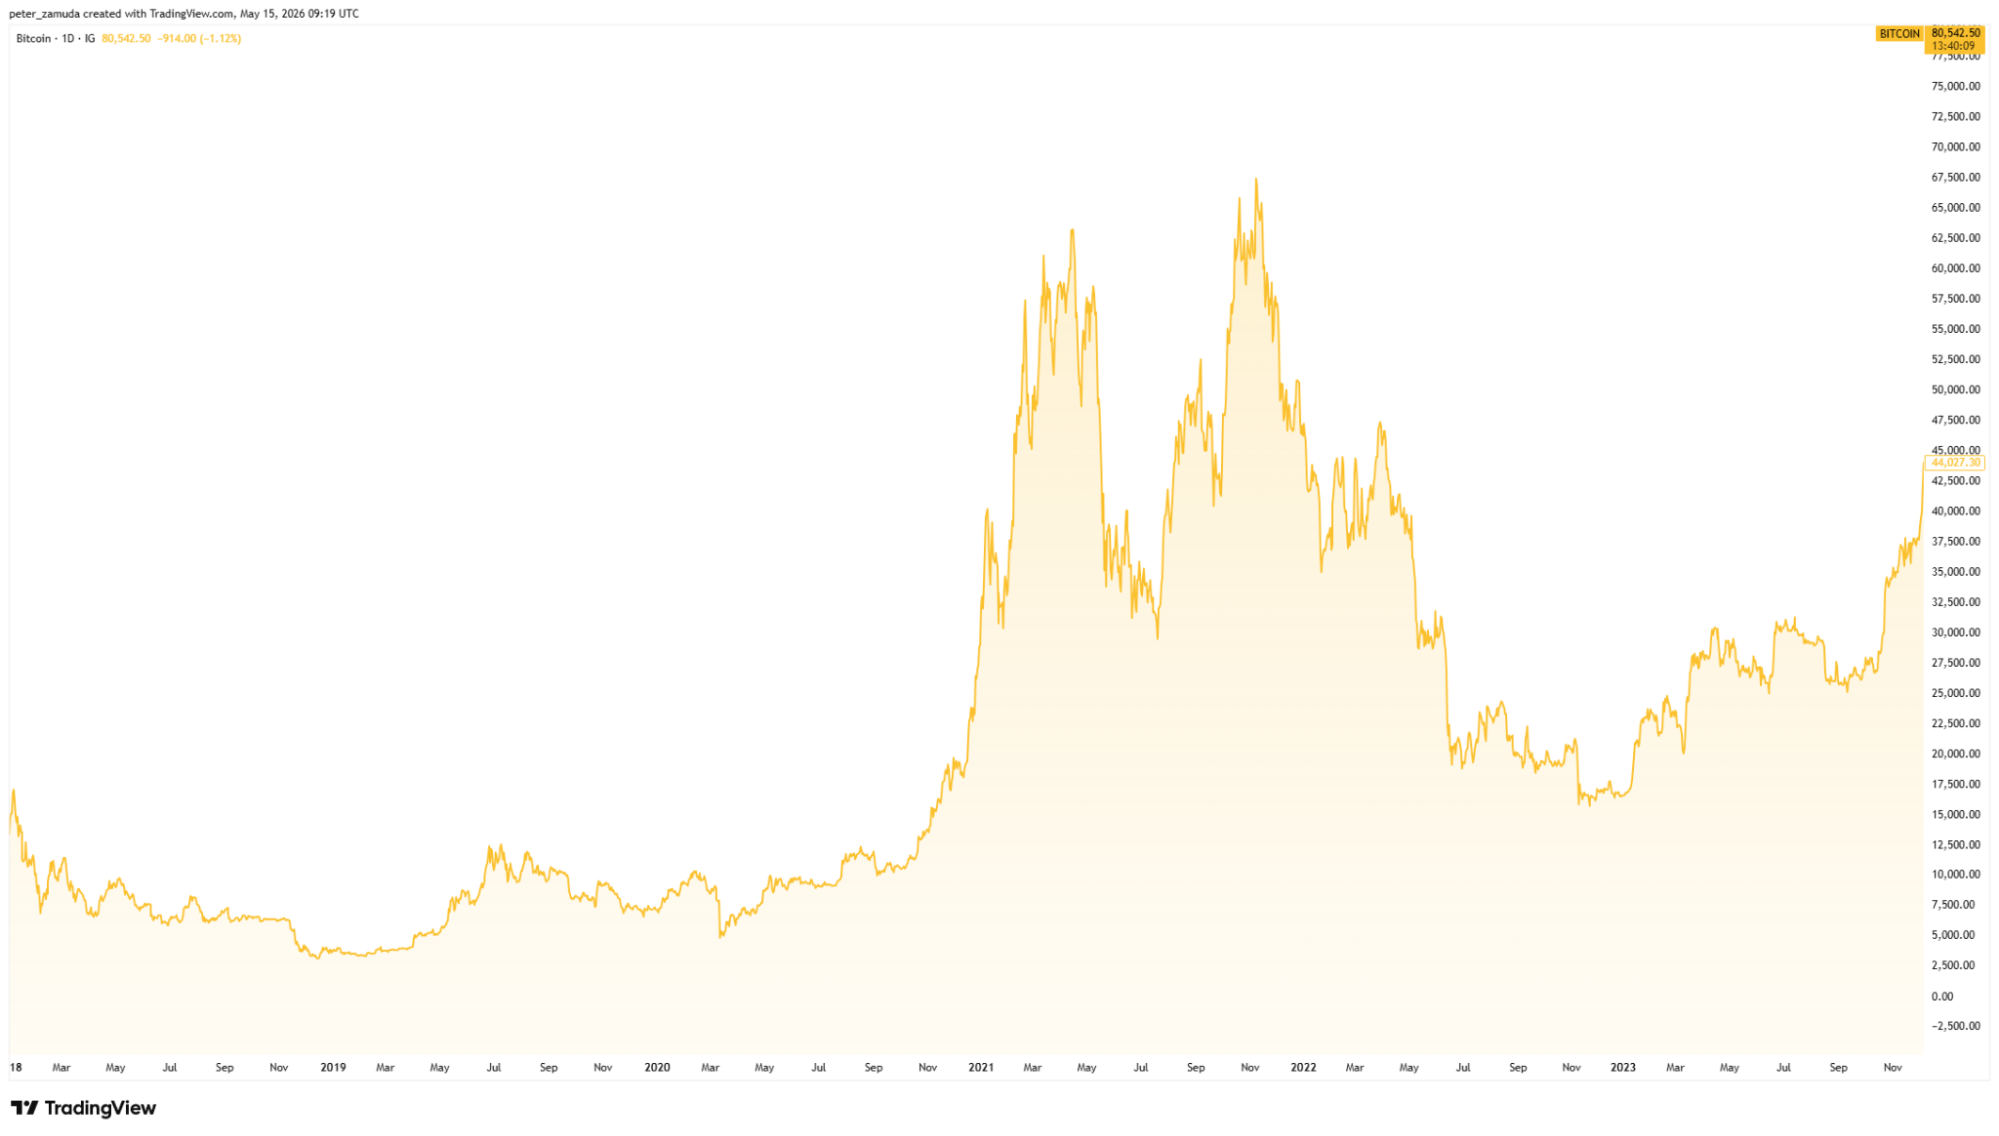
Following the 2017 peak, Bitcoin retraced below $10,000 and eventually fell to roughly $4,000 in 2018. The market entered another prolonged consolidation phase. However, the next structural shift was fundamentally different.
The COVID-19 pandemic and subsequent global monetary expansion in 2020 changed the narrative around Bitcoin. Massive fiat liquidity injections, historically low interest rates, and rising concerns about currency debasement led institutions to reconsider digital scarcity as a macro hedge.
By November 2021, Bitcoin reached $68,770. Public companies added BTC to their balance sheets, institutional custody solutions expanded, and derivatives markets matured significantly. Bitcoin was no longer merely a speculative tech asset. It had entered macro conversations alongside gold and equities.
The 2022 bear market brought BTC down to approximately $16,700, yet the recovery through 2023, closing the year above $42,000, signaled structural resilience.
ETF Expansion and the Six-Figure Era (2024–2025)
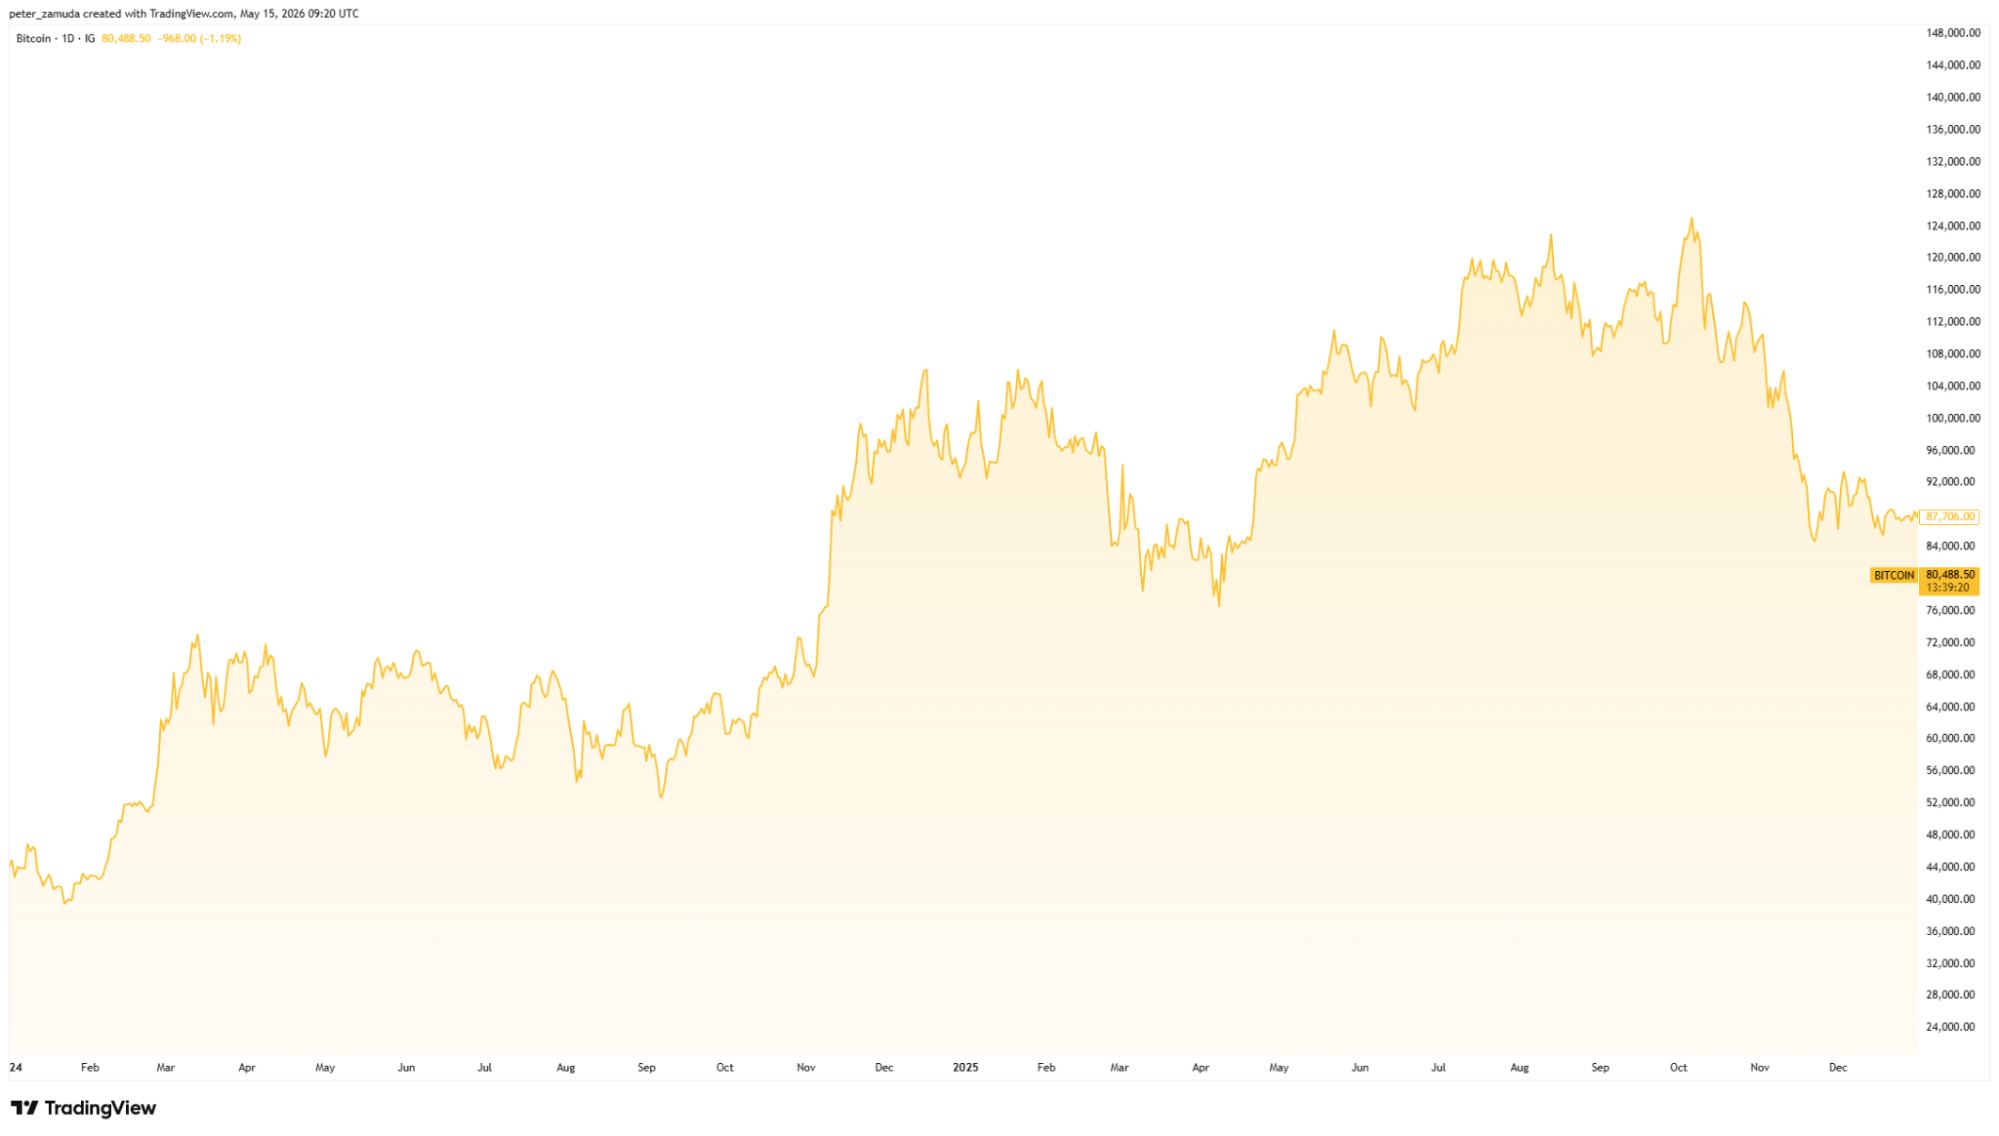
The launch of spot Bitcoin ETFs in early 2024 represented another pivotal milestone. Institutional capital gained streamlined access to BTC exposure without direct custody requirements. This structural demand accelerated price momentum.
Bitcoin reached $73,608 in March 2024, later breaking the $100,000 milestone for the first time in December. The rally continued into 2025, culminating in a new all-time high of $126,000 in October.
This cycle differed from prior ones. Liquidity depth was stronger, derivatives infrastructure was mature, and institutional participation was significantly higher. However, volatility persisted. After peaking, Bitcoin retraced below $100,000 and entered 2026 near the $90,000 range.
2026 So Far: Volatility Within Maturity

In early 2026, Bitcoin experienced another sharp correction, briefly falling toward $65,000 before stabilizing near $80,000. While dramatic in nominal terms, this volatility is materially different from earlier cycles. Market depth, ETF flows, and institutional frameworks now act as stabilizing mechanisms.
Bitcoin remains volatile, but its structural role has evolved. It operates within a global liquidity ecosystem rather than at its margins.
The Structural Pattern Across Cycles
Across every major phase, a repeating dynamic emerges. Bitcoin enters a rapid expansion driven by new adoption catalysts, corrects sharply as leverage unwinds, consolidates while infrastructure strengthens, and then re-enters a new adoption wave at a higher base level.
Over time, the magnitude of percentage gains has compressed, but systemic risk has declined as well. Each cycle has expanded the participant base and deepened liquidity.
The Long-Term Perspective
Bitcoin began at less than one-tenth of a cent. It has survived exchange failures, regulatory scrutiny, global economic shocks, and repeated market collapses while reaching six-figure valuations. Its price history reflects both extreme volatility and persistent long-term growth.
The evolution of Bitcoin is not defined by uninterrupted appreciation, but by cyclical expansion, structural maturation, and increasing integration into the global financial system. If past cycles offer any indication, volatility remains inevitable, but so does continued evolution.


- Crypto FIFA World Cup Sponsors In 2026: Blockchain & Web3 Brands Backing Global Football
- Beginner’s Guide to Crypto Exchange: How It Works and Where to Start
- Exchange ETH to XMR Without KYC in 2026: GhostSwap and the Best Alternatives
- Bitcoin to Zcash and Back: The 2026 ZEC – BTC Swap Guide with GhostSwap and More
- How to Swap BTC to XMR In 2026: Full Step-by-Step Guide


