Ethereum Price Analysis: Will $ETH Price Surpass $2000 this Week?


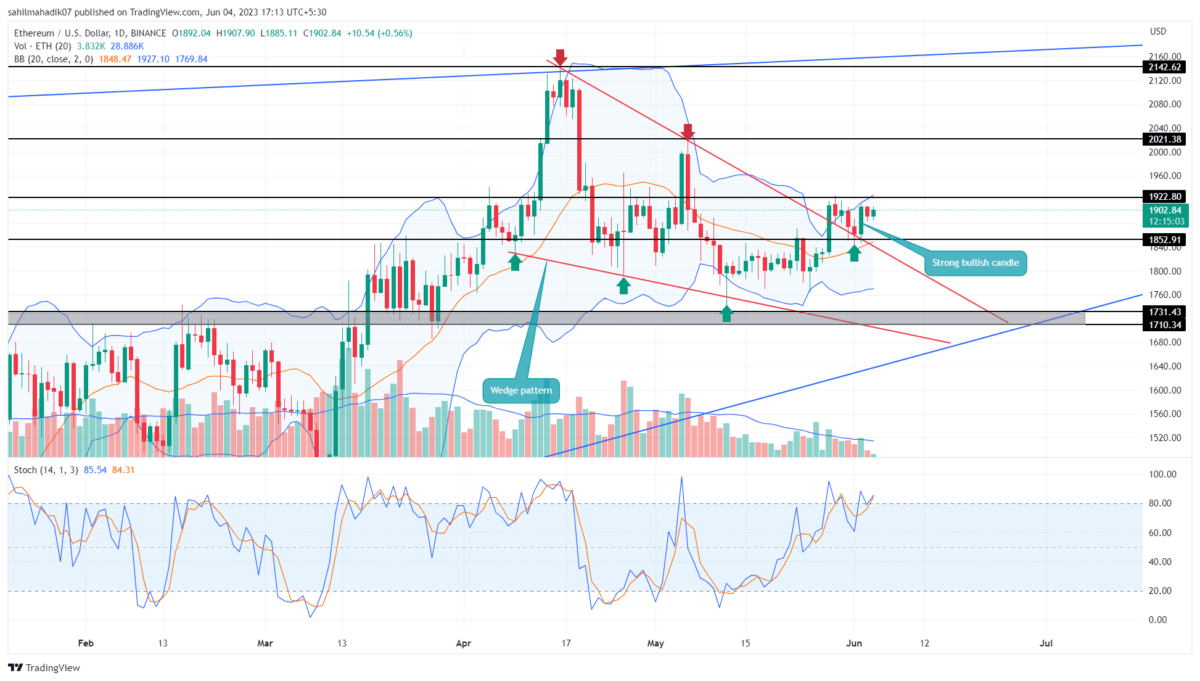
Ethereum Price Analysis: By the press time, the Ethereum price traded at the $1905 mark with an intraday day of 0.7%. The daily chart shows the buyers facing a minor hurdle at the local top $1922 formed during the breakout of the wedge pattern. If the coin price successfully flips this barrier into suitable support, the buyers will obtain excellent follow-up for the bullish breakout and will pave the way for further recovery.
Also Read: Ethereum Advocate Predicts “Layer-2 Summer” Next Year; Which Tokens To Rally?
Ethereum Price Daily Chart
- The recent correction in Ethereum price rebounded below the 38.2 Fibonacci retracement level projecting the overall market trend remains bullish.
- A potential breakout above $1922 will trigger a quick 5.5% rise in ETH
- The intraday trading volume in Ether is $3.3 Billion, indicating a 28% loss.
 Source- Tradingview
The June 2nd daily green candle is crucial for the Ethereum price signifying several traits for the upcoming rally. The long bullish candle formed at the recently breached angular trendline and horizontal resistance of $1850 indicates that buyers are sustaining prices at high levels and should maintain further growth.
In addition, the green candle also engulfed the last three days’ price action with sufficient volume indicating the high momentum of buying. Therefore, a breakout above the overhead barrier of $1922 indicates the next significant resistance is directly at $2000 followed by $2138.
In addition, the low of the June 2nd candle stands as a important support, and therefore breakdown below it will offset the bullish thesis.
Will Ethereum Price Ready to Hit $2000?
The wedge pattern breakout was a sign of a trend reversal which set the ETH price on a recovery path. In technical analysis, the swing highs formed during the development of the chart pattern are the significant target. Therefore, if the buyer breach $1922 in the coming week, the price will witness a sharp rally to $2000.
- Bollinger Band: An uptick in the higher band of BB indicator projects the buying is still aggressive.
- Stochastic: The indicator slopes K%(blue) and D%(orange) have spent most time above the 80% mark in the past few months, indicating the Ethereum coin is an outperformer.


- Trump-Backed Alt5 Sigma Under Fire for Possible SEC Rule Violations, New Report Reveals
- Just-In: Spot Solana ETF Records Largest Outflow While XRP ETFs Nets $90M
- Breaking: U.S. FDIC to Release First Stablecoin Guidelines Under GENIUS Act this Month
- Fed Chair Jerome Powell Speech: Bitcoin Climbs as December Rate Cut Odds Waver
- Crypto ETF News: Vanguard to Enable Trading of BTC, XRP, SOL ETF on Its Platform
- XRP Price Prediction as Ripple Gets MAS Licence in Singapore
- Ethereum Price Crashes Below $3,000 as $500M Longs Liquidated: What’s Next?
- Pi Network Price Prediction Ahead of December’s 190M Scheduled Unlock
- Dogecoin Price Below $0.15 as Crypto Market Crashes: Will $0.10 Hold?
- Will the Binance Coin Price Rebound as a Key RWA Metric Jumps 99%
- AVAX Price Prediction After Bitwise Files for a Staking ETF — A Rebound Coming?


Why Trust CoinGape
CoinGape has covered the cryptocurrency industry since 2017, aiming to provide informative insights Read more…to our readers. Our journal analysts bring years of experience in market analysis and blockchain technology to ensure factual accuracy and balanced reporting. By following our Editorial Policy, our writers verify every source, fact-check each story, rely on reputable sources, and attribute quotes and media correctly. We also follow a rigorous Review Methodology when evaluating exchanges and tools. From emerging blockchain projects and coin launches to industry events and technical developments, we cover all facets of the digital asset space with unwavering commitment to timely, relevant information.
Premium Partners


