Is BTC Price Breakout Above $27000 Sustainable?


On 29th August, the BTC price broke free from two weeks of indecisive movement created within two downsloping trendlines. Today, the BTC price witnessed a massive inflow in response to a federal court verdict in favor of Grayscale over the U.S. Securities and Exchange Commission (SEC) for Bitcoin ETF. The bullish jump reclaimed the $27000 mark offering a suitable launchpad for further gain.
Also Read: Grayscale Victory: Expert Reveals What Comes Next for Bitcoin ETF
Bitcoin Daily Chart: Key Points
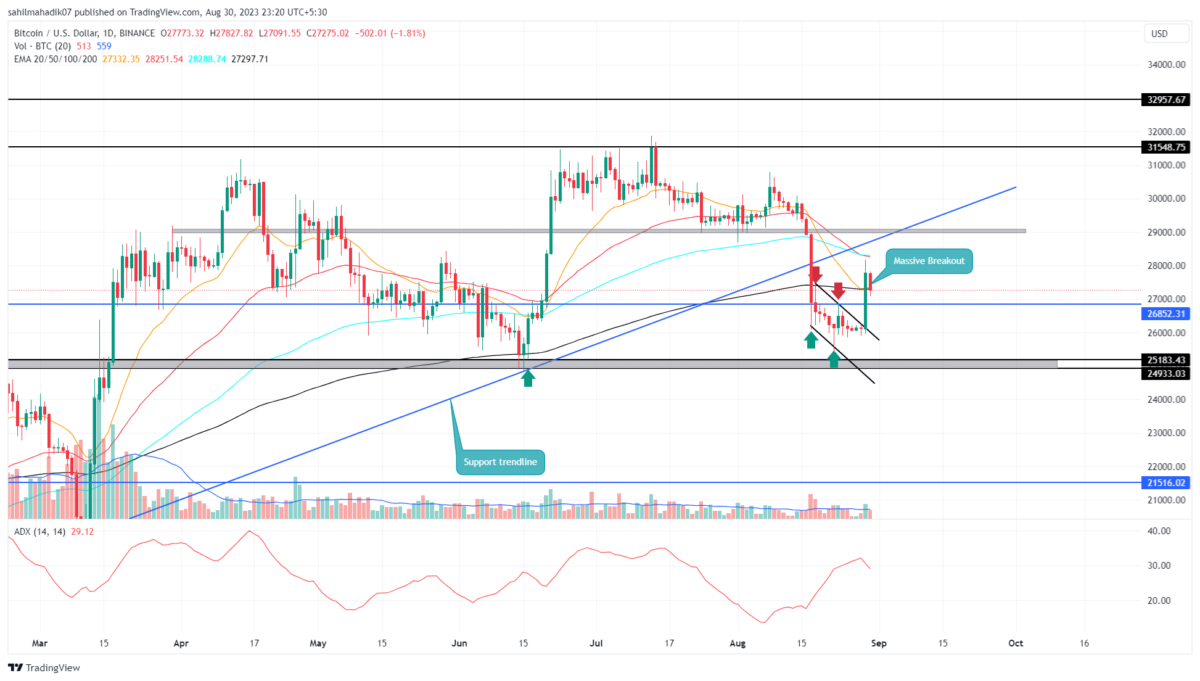
- The bullish engulfing candle enveloped the last two weeks’ price action, indicating a significant candle for buyers to counterattack
- A potential breakout above $29000 could set BTC up for a higher rally
- The intraday trading volume in Bitcoin is $21.9 Billion, indicating a 7% loss.
 Source- Tradingview
The August 29th bullish candle recorded a 6.35% gain and reached a high of $28180. This price jump offered a high momentum breakout of the immediate barrier of $27000 and also reclaimed the 200-day EMA.
However, the Bitcoin price did not offer a follow-up candle and showed a 1.8% intraday fall. If this minor pullback is sustained above the 200-day EMAs or $27000 the buyers will drive the bullish bounce 6.3% higher to reach the $29000 barrier.
The aforementioned barrier aligned with the high of the August 17th sell-off candle indicates the coin holders may witness an intense supply zone at this level. Therefore, the buyers must break above this resistance to get a suitable confirmation of price recovery.
[converter id=”btc-bitcoin” url=”https://coingape.com/price/converter/btc-to-usd/”]
Can BTC Price Fall Below $25000?
A keen look at the daily time frame chart shows the anticipated upswing in Bitcoin price could be a minor retest to the recently breached channel pattern on August 17th. The pullback may recuperate the exhausted selling momentum at $29000 to prolong the downtrend even below the $25000 psychological level. Therefore, the crypto holder must keep a close watch on the price behavior at overhead resistance.
- Average Directional Index: A downtick in the daily ADX slope reflects the weaknesses of prevailing bearish momentum and a higher possibility of bullish recovery.
- Exponential Moving Average: The recently reclaimed 50-and-200-day EMA can offer strong support for Bitcoin recovery.


- Operation Choke Point: House Republicans Spotlight Biden Administration’s ‘Attack on Crypto’
- Polymarket Rival Kalshi Moves On-Chain With Launch of Tokenized Prediction Markets on Solana
- Tom Lee Says Bitcoin Could Hit New ATH In January As Hassett Becomes Favorite For Fed Chair
- 8 Best Crypto Exchanges That Accept PayPal Deposits and Withdrawals
- Jerome Powell Speech Today: What To Expect as Fed Ends QT
- XRP Price Prediction as Ripple Gets MAS Licence in Singapore
- Ethereum Price Crashes Below $3,000 as $500M Longs Liquidated: What’s Next?
- Pi Network Price Prediction Ahead of December’s 190M Scheduled Unlock
- Dogecoin Price Below $0.15 as Crypto Market Crashes: Will $0.10 Hold?
- Will the Binance Coin Price Rebound as a Key RWA Metric Jumps 99%
- AVAX Price Prediction After Bitwise Files for a Staking ETF — A Rebound Coming?


Why Trust CoinGape
CoinGape has covered the cryptocurrency industry since 2017, aiming to provide informative insights Read more…to our readers. Our journal analysts bring years of experience in market analysis and blockchain technology to ensure factual accuracy and balanced reporting. By following our Editorial Policy, our writers verify every source, fact-check each story, rely on reputable sources, and attribute quotes and media correctly. We also follow a rigorous Review Methodology when evaluating exchanges and tools. From emerging blockchain projects and coin launches to industry events and technical developments, we cover all facets of the digital asset space with unwavering commitment to timely, relevant information.
Premium Partners


