


- Bitcoin price hits a thick resistance all at $9,500 but bulls are intentional on containing the price above $9,400.
- The falling wedge pattern remains the key to $10,000 as long as the breakout is accorded proper volume support.
Bitcoin price is struggling with the amount of selling pressure at $9,500. All attempts to break above this level have been thwarted by acute selling pressure. For instance, On Tuesday, Bitcoin bulls pushed the price far above $9,500 but they hit a thick wall at $9,600. A reversal ensued, sending Bitcoin back to $9,250 support. At the time of writing, BTC/USD has recovered slightly above $9,400 but the selling pressure in the market is has gone nowhere.
Marginally above the market value ($9,400), Bitcoin is facing a hurdle at the 50 Simple Moving Average (SMA) on the 4-hour chart. Before the price wriggles further north, the bullish momentum is challenged by another seller congestion brought about a prominent descending trendline. The trendline forms part of a falling wedge pattern (discussed below).
BTC/USD 4-hour chart
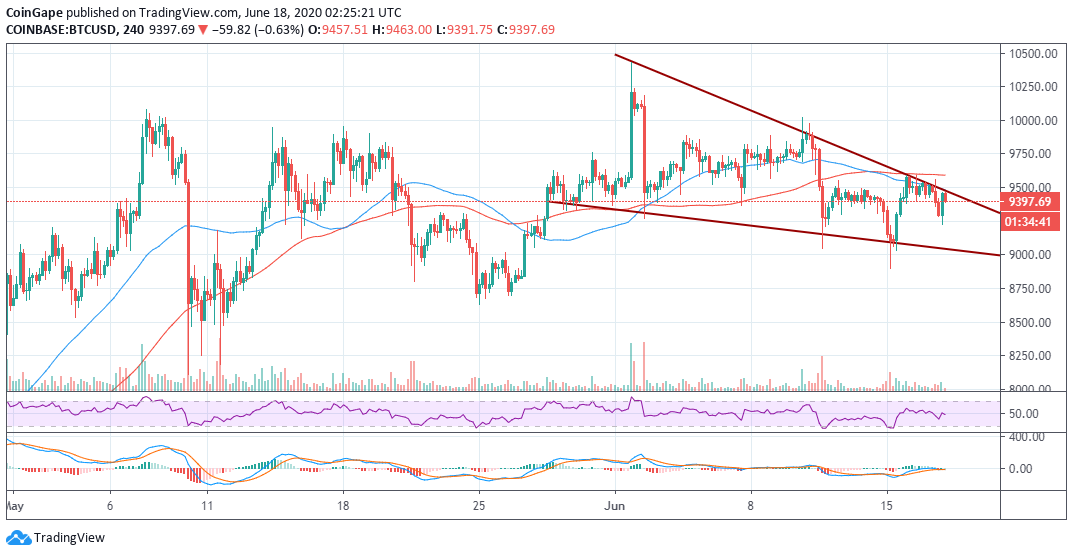
From a technical perspective, Bitcoin is generally dealing with a bearish biased trend. The Relative Strength Index (RSI) is changing direction downwards, suggesting that declines are likely to continue towards $9,250 (recent support). On the other hand, the MACD shows that buying pressure is not absent per se. For this reason, Bitcoin has a fighting chance to contain losses above $9,400.
Glancing up, the formation of a falling wedge pattern presents a glimmer of hope to the investors that recovery will come eventually. If a break above the wedge comes into the picture and Bitcoin is treated to proper volume, we could see a smooth ride above $9,600 as well as the levels heading to $10,000. In the meantime, sustaining the price above $9,400 is the bulls’ priority.
Bitcoin Intraday Levels
Recommended Articles


Spot rate: $9,400
Relative change: -57
Percentage change: -0.61
Trend: Bearish
Volatility: High
- FBI Issues Warning Against Non-Compliant Crypto Money Services
- Fed Rate Cut Hopes Dampen Amid Surging Q1 Inflation
- ViaBTC Auctions “Epic Sats” From Latest Halving Auctioned Off For $2.13M
- Aimie Killeen Appointed as Chief Legal Officer of Digital Currency Group
- Bitcoin Whales Taking Unrealized Profits Could Impact The Market: Report
- Can Terra Classic Coin Leverage Market Consolidation For a Price Rally?
- 2 Trending Altcoins To Hold Targeting 100X Profit Post Bitcoin Halving
- Top 3 Crypto To Invest In 2024 – Expert Reveals
- Bitcoin Price Today: Are Curtains Closing On Explosive $100,000 BTC Rally In 2024?
- Dogecoin Price Forecast: Is the Current Dip a Buying Opportunity?

 Mallconomy


