Bitcoin Price Analysis: BTC/USD Big Picture, Why $10,000 Must Come Down For Further Gains?


- Bitcoin is focusing on sustaining the uptrend but a break above the long term trendline is critical for continued growth.
- BTC/USD must hold above the 50 SMA in the weekly range to avoid possible declines likely to test triangle support.
Bitcoin is facing the ongoing struggle under $9,000 simply because it failed to break above the key downtrend (check the descending trendline on the chart) several times. The weekly chart widens Bitcoin’s technical picture and we can clearly see what the buyers must do to keep the bullish momentum intact.
Interestingly, the market can be said to be bullish despite the lower swing highs and swing lows. For instance, BTC/USD is currently trading above the 50-day SMA (functioning as immediate support). The 50 SMA is above 100 SMA which is also above the longer-term 200 SMA, all of which point towards a bullish market.
The way the situation is, Bitcoin is coming from a stronger bullish market, although it failed to break the downtrend. Its main aim, for now, is to continue nurturing the uptrend and to do so, the price has to break the downtrend line. In other words, the action at the downtrend line remains very vital to further upward movement in the near term.
In the event, the price bounces off the downtrend line, Bitcoin would start to spiral under the 50 SMA as well as the 100 SMA. Extended declines could also test the 200 SMA and the triangle support. A break, particularly, below the triangle support would signal the beginning a stronger downtrend.
BTC/USD weekly chart
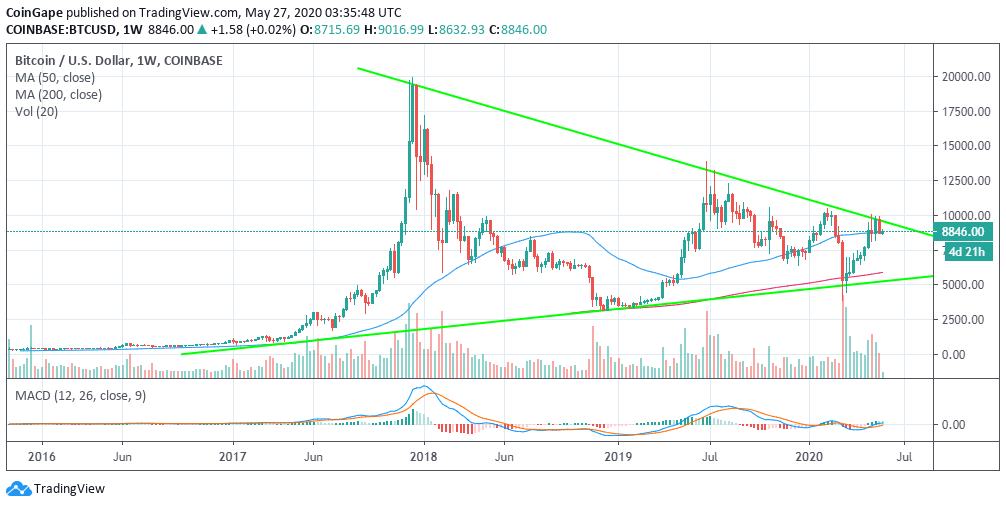
From a different technical perspective, Bitcoin is currently in the hands of the bulls as observed using the MACD. The indicator has recovered from the recent dip and is now settling above the mean line. This shows that bulls are in the driver seat, waiting for a technical breakout. However, low volume and many bulls waiting for a confirmed breakout continue to delay BTC/USD progress.
Bitcoin Intraday Key Levels
Spot rate: 8,839
Relative change: -5
Percentage change: -0.05
Trend: Bullish
Volatility: Expanding
High: $8,893
Low: 8,812
Why Trust CoinGape
CoinGape has covered the cryptocurrency industry since 2017, aiming to provide informative insights Read more… to our readers. Our journal analysts bring years of experience in market analysis and blockchain technology to ensure factual accuracy and balanced reporting. By following our Editorial Policy, our writers verify every source, fact-check each story, rely on reputable sources, and attribute quotes and media correctly. We also follow a rigorous Review Methodology when evaluating exchanges and tools. From emerging blockchain projects and coin launches to industry events and technical developments, we cover all facets of the digital asset space with unwavering commitment to timely, relevant information.
Delivered every day.
- Insights that move markets
- 100,000 active subscribers
Related Articles


- Crypto Market Bill Markup Now Uncertain As Senate Cancels Monday Sessions
- CLARITY Act: Gillibrand Sees Path Forward for Crypto Bill as Democrats Clash Over Presidential Ban
- Cathie Wood’s Ark Invest Files for BTC, ETH, SOL, XRP, ADA Crypto Index ETF
- Crypto ETF Issuer Grayscale Files S-1 for Binance Coin (BNB) ETF With SEC
- Did GameStop (GME) Capitulate? Retailer Moves All Bitcoin Holdings to Coinbase in Potential Sell-Off
- Bitcoin and Gold Outlook 2026: Warsh, Rieder Gain Traction in Trump’s Fed Pick
- PEPE Coin Price Eyes 45% Rebound as Buyers Regain Control on Spot Markets
- Pi Network Price Prediction: Will PI Coin Hold Steady at $0.18 Retrace Lower?
- Dogecoin Price Prediction as 21Shares Announces DOGE ETF
- GME Stock Price Outlook as CEO Ryan Cohen Buys Shares Amid Store Closures
- Bitcoin Price Outlook as US Senate Delays CLARITY Act Again


