 Buy $GGs
Bitcoin Price Analysis: Can $BTC Bulls Anticipate $30000 Breakout in Current Recovery?


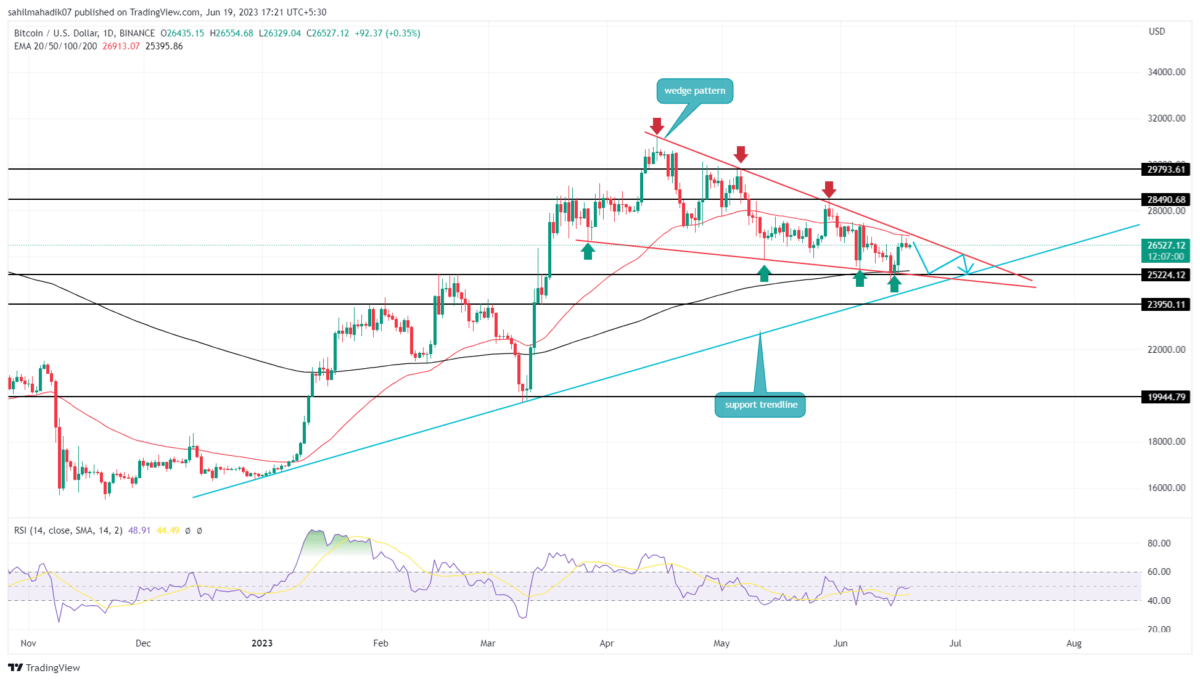
Bitcoin Price Analysis: The Bitcoin price initiated a minor recovery rally in mid-June offering relief to the coin holders from the recent sell-off in the crypto market. From the local support of $25200, the prices surged 5% to reach the current price of $26473. However, the daily candles started to project higher price rejection suggesting the broader market sentiment is still bearish. Can buyers turn the tables with the current recovery or will the seller continue to have the upper hand?
Also Read: Bitcoin Price Bulls Take Charge: Is a $42,000 Breakout Imminent?
Bitcoin Price Daily Chart:
- The narrow area between the wedge pattern can be considered a no-trading zone
- The Bitcoin fear and greed index at 48% reflects neutral market sentiment.
- The intraday trading volume in Bitcoin is $9.12 billion, indicating a 38% loss.
 (Source: Tradingview)
Under the influence of a falling wedge pattern that governs the current retracement phase in Bitcoin price, the recent relief rally is likely a temporary growth. A bullish reversal from the pattern’s lower trendline triggers a new bull cycle which may push the prices back to the upper trendline.
As of now, the BTC price trades quite close to the overhead trendline, and there, the supply pressure is visible with the long-wick rejection candles. If the selling pressure persists for a few more trading traders, the coin price could trigger a bearish reversal.
This potential reversal will signal the continuation of the downward trend and lead the price back $25000.
Thus, the completion of this chart pattern is needed to free the Bitcoin price from the correction phase.
Will Bitcoin Price Rise to $27,000?
With the recent price surge, the BTC price is likely to hit the resistance trendline of the wedge pattern, trying to validate the overhead supply. The potential traders must remain still and watch the price behavior at this trendline to determine future prospects. A potential reversal from this barrier will prolong the current downfall, while an upside could pave the way for sustained recovery.
- Relative Strength Index: Contrary to the new lower low in price action, the RSI slope forming the same lows indicate the underlying bullish momentum in growing.
- Exponential Moving Average: The 50-and-200-day EMA creates a narrow range that may carry the possible consolidation phase in Bitcoin price.
Play 10,000+ Casino Games at BC Game with Ease
- Instant Deposits And Withdrawals
- Crypto Casino And Sports Betting
- Exclusive Bonuses And Rewards


Why Trust CoinGape
CoinGape has covered the cryptocurrency industry since 2017, aiming to provide informative insights Read more…to our readers. Our journal analysts bring years of experience in market analysis and blockchain technology to ensure factual accuracy and balanced reporting. By following our Editorial Policy, our writers verify every source, fact-check each story, rely on reputable sources, and attribute quotes and media correctly. We also follow a rigorous Review Methodology when evaluating exchanges and tools. From emerging blockchain projects and coin launches to industry events and technical developments, we cover all facets of the digital asset space with unwavering commitment to timely, relevant information.


Related Articles


- Bitcoin News Today: BTC on the Verge of ‘Banana Split’, Peter Brandt Predicts Imminent Breakout
- Breaking: Trump Says The U.S.-Iran War Could End Soon, Mulls Taking Over Strait Of Hormuz
- Bhutan Dumps More Bitcoin as BTC Price Climbs Amid Falling Oil Prices
- Bitget Upgrades Agent Hub to Enable OpenClaw, Claude Code to Trade Crypto in Real Time
- Why Next Two Weeks Are Do or Die for Crypto Market?
- Top Analyst Explains Why Pi Network Price May Soar to $0.50 This Week
- Is MSTR Stock Going to Rally $150?
- Bitcoin And XRP Price Prediction As US Oil Prices Fall Sharply- Will This Spark a New Bull Rally?
- Is It a Good Time to Buy XRP As Price Falls 64% From All-time High
- Will Crypto Market Crash This Week? Analysts Predict Timeline for Volatility
- Gold Price Prediction Ahead of March 18 FOMC Meeting


