Ripple is up 26% over the last 24 hours following a rebound from the support established at $1. This recovery took place in tandem with Bitcoin’s return above $50,000 and Ethereum’s rally past $2,500. XRP trades at $1.4 at the time of writing amid the bullish impact from the falling wedge pattern.
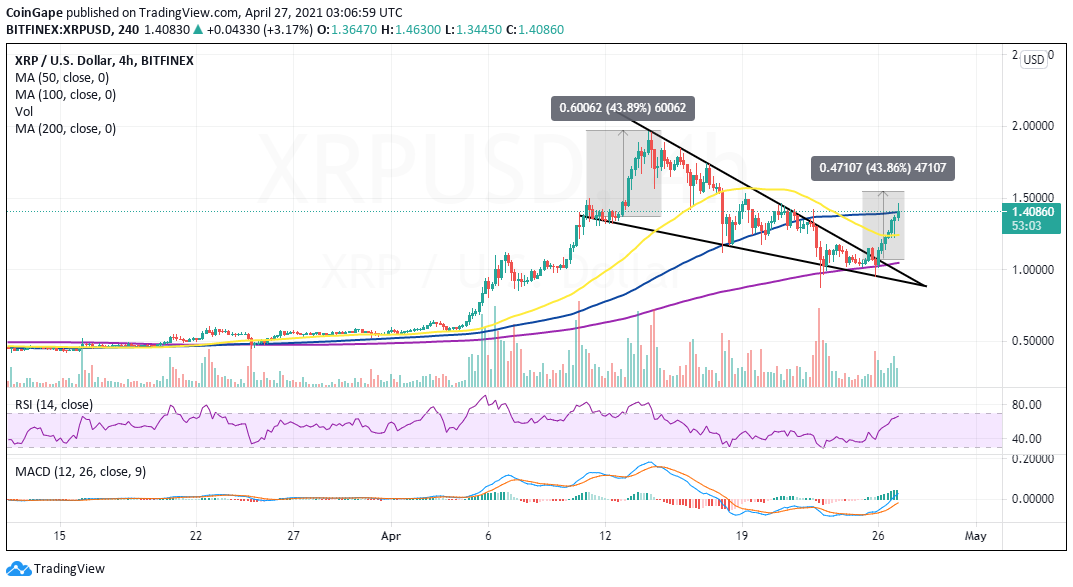
The four-hour chart brings to light the formation of the highly bullish pattern. Note that falling wedge molds amid a downtrend. Two trend lines converge to make the pattern, connecting lower highs and lower lows.
As the gap between the lines narrows, the asset moves closer to breakout. Usually, an ultimate uplift occurs once the price cracks the upper trend line’s resistance. For instance, Ripple is in the middle of the breakout, bouncing off the support at $1.
Meanwhile, bulls seek support above $1.4, which will allow them to focus on highs above $1.5 and toward $2. The immediate upside is capped by resistance at the 100 Simple Moving Average (SMA). If broken, Ripple will quickly face the remaining hurdles heading to $2.
Besides the wedge pattern breakout, the Ripple’s uptrend has been supported by the Moving Average Convergence Divergence (MACD) indicator. The indicator has reentered to positive territory, and the MACD line (blue) crosses above the signal line. If the technical picture remains unchanged, the uptrend will continue throughout the coming sessions.
The Relative Strength Index (RSI) also validates the uptrend after making a gradual recovery from the oversold region. Cracking its way into the overbought area would trigger more buy orders adding to the tailwind for gains toward $2.
Spot rate: $1.4
Trend: Bullish
Volatility: High
Support: The 50 SMA on the four-hour chart, $1.12 and $1
Resistance: The 100 SMA, $1.5 and $2
The Ethereum Foundation is once again in the spotlight with fresh on-chain activity, which sparked…
The TRUMP coin price nosedived over 10% amid a high stakes drama security incident involving…
The Federal Reserve is likely to hold steady on interest rates at its next Federal…
Bitcoin is down from its intraday high today after U.S. President Donald Trump canceled his…
Ripple CEO Brad Garlinghouse received another prestigious award this week. He was awarded as the…
Grant Cardone, founder of the $5.3 billion Cardone Capital has confirmed his attendance at a…