ADA Price to Hit 0.22? Bearish Pennant Formation Signals a 15% Dip
In response to recent uncertainty in the crypto market, Cardano’s (ADA) daily chart shows a minor relief rally. This upward movement is driven by ascending trendlines, forming a bearish pennant. While the bullish sentiment aligned with Bitcoin ETF is feeding the crypto market has witnessed an aggressive downfall and bolstered a bearish breakdown of the afromention pattern. Should you sell on this?
Also Read: XRP And Cardano Records Buying Amid Largest Crypto Funds Outflow
Bearish Pattern Hints Extended Correction in ADA price
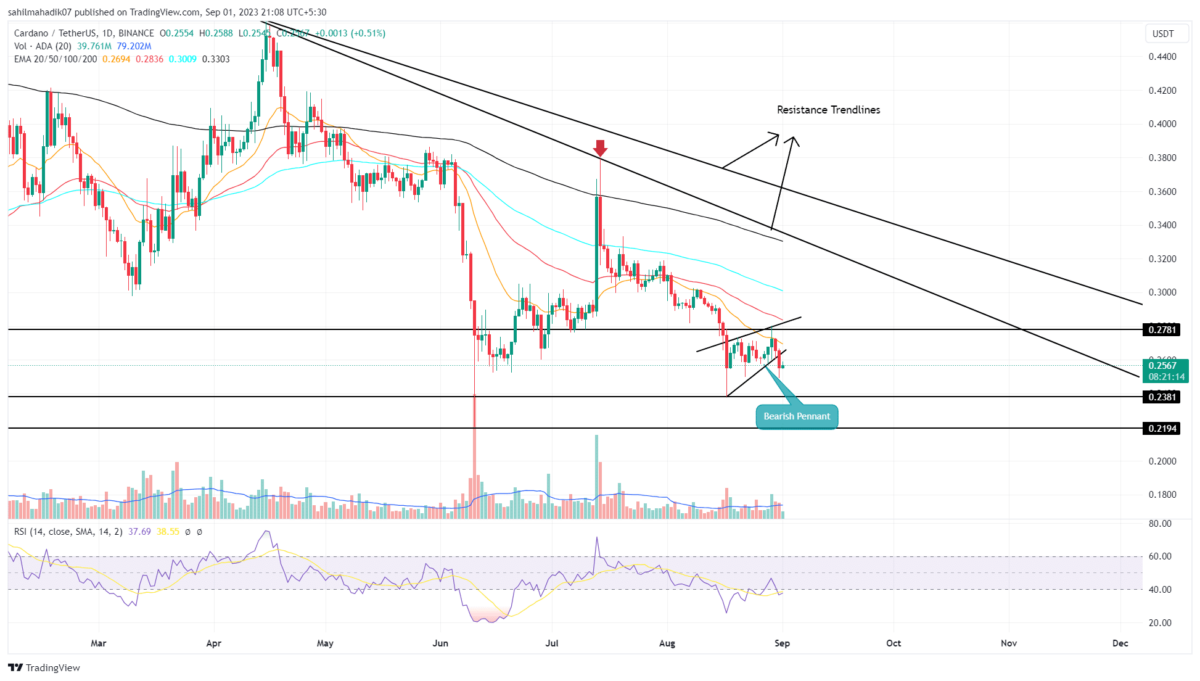
- Completion of bearish pennant pattern bolsters ADA price for 15% fall
- The coin buyers may experience demand pressure at $0.238 and $0.22 horizontal
- The intraday trading volume in the ADA coin is $207 Million, indicating a 14.2% gain
The bearish pennant pattern is often spotted in an established downtrend offering a brief break of sellers to replenish bearish momentum. With the continuation of selling sentiment in the market, the altcoin price gave a breakdown from the pattern support trendline on August 30th.
This breakdown signals for the continuation of a downward trend providing a short selling opportunity to market participants. With the intraday gain of 0.23%, the ADA showed a minor upswing to retest the flipped resistance.
Currently, the Cardano price trades at $0.258 with the current market cap at $9.06 Billion
If the coin price shows sustainability below the breached trendline, the prices may tumble the price 15% to hit $0.28 support followed by $0.22.
Will the Cardano Sideways Trend Continue?
While ADA price is currently declining, it’s worth noting that over the past week, its movement has been confined within the range defined by the August 17th candle, with a high of $0.278 and a low of $0.023. These levels now act as strong resistance and support. If the price falls to $0.238, the sellers may gain better confirmation for further downfall
However, if the demand pressure persists at this support, the sideways trend may extend longer
- Relative Strength Index: The RSI indicator slope falling below the 40% mark reflects strong bearish momentum.
- Exponential Moving Average: The ADA price witnessing a dynamic resistance from the 20-day EMA slope.
Recent Posts
- Price Analysis
ApeCoin Price Prediction: Breakout Ahead or Short-Term Spike?
ApeCoin price surged more than 50% within 24 hours, with trading volume hitting $1.19 billion…
- Price Analysis
How High Will BTC Price Go Ahead of Bitcoin Conference 2026 Next Week
Bitcoin (BTC) has been moving higher for the last few weeks, with no clear reason…
- Price Analysis
Analyst Predicts XRP Price Pump Could Start Soon: Here’s When
XRP price might be getting ready to pump, and this is according to several analysts…
- Price Analysis
Can Bitcoin and Ethereum Price Mirror the S&P 500 Rally as Trump Fuels Best Stock Market Returns?
The US stock market has been making consistent gains for the last few months. Despite…
- Price Analysis
TRUMP Meme Coin Price Prediction Ahead of Trump Crypto Conference Tomorrow
OFFICIAL TRUMP coin hovered at $2.89 on Friday ahead of President Donald Trump’s keynote appearance…
- Price Analysis
TSLA Stock Price Outlook as Stronger Than Expected Q1 Earnings Mask $173M Bitcoin Loss
Tesla (NASDAQ: TSLA) posted stronger-than-expected Q1 2026 earnings, driving a slight 0.28% gain in TSLA…