Aptos Price Prediction as Buyers Break 200 Days Resistance; Will they Reclaim $8?
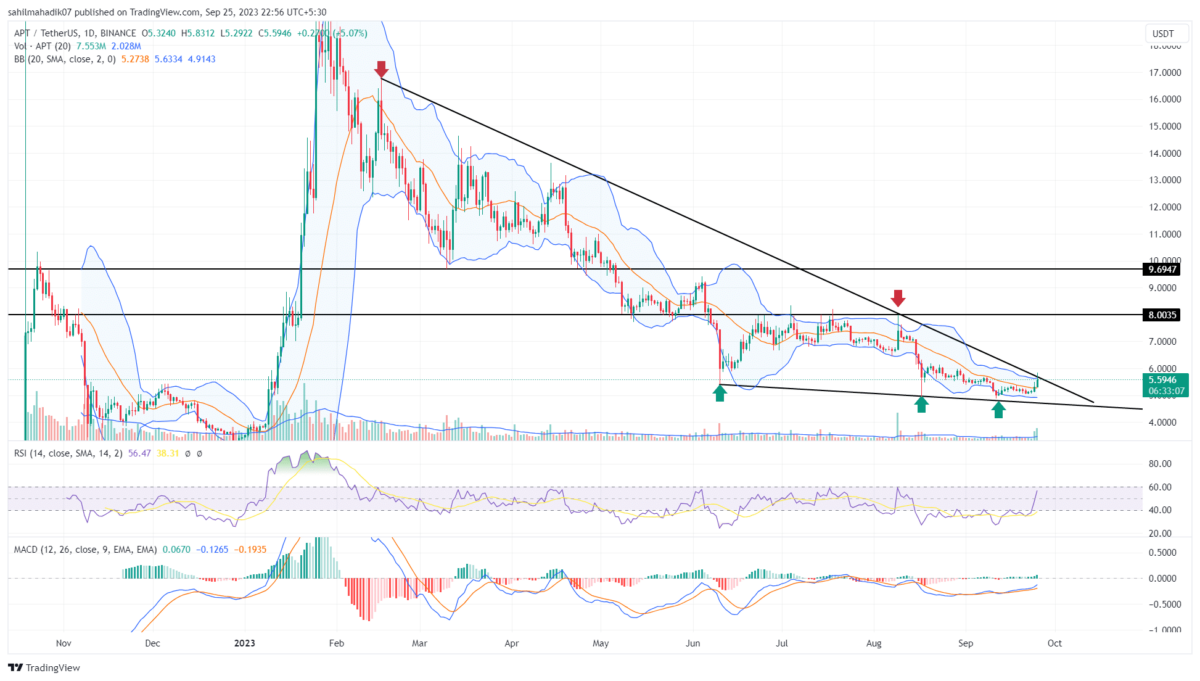
Contrary to the recent downturn in the crypto market, the APT price has witnessed a significant inflow since last weekend. The coin price rose for four consecutive days, has recorded a 12% gain, and challenges the long-coming price and timeline. A potential breakout from this barrier would be a key signal of sustained recovery.
Also Read: Central American Country Uses Bitcoin To Conduct Fair Election; Here’s How
Will its New Found Recovery Continue?
- The APT price faces dynamic resistance from a falling trendline.
- A potential bullish breakout from the overhead trendline will be an early sign of trend reversal
- The intraday trading volume in APTer is $343.2 Billion, indicating a 20% gain
Since February 2023, the Aptos coin price has experienced a significant correction, registering a 73% loss from its all-time high of $19.9. However, the daily chart shows the coin price has started molding between converging trend lines, acting as dynamic resistance and support.
With the recent uptick in APT price, the buyers knock on the door of the upper trendline—a barrier that’s held firm for nearly 200 days. However, the visible price rejection on the day’s candle might indicate that sellers are still guarding this fortress. If they maintain their stance, this altcoin might retract and trigger a new bear cycle within the wedge formation of trendlines.
The potential decline may plunge the prices 18% down to hit the lower trendline.
Will Aptos Rise to $8?
Until the two trendlines are intact, the Aptos coin rise may continue their ongoing downtrend. However, the converging nature of this trend line would eventually lead to a decisive breakout. If we lean on the side of optimism, a bullish breakout from the upper trend line could pave the way for buyers to regain control, ushering in a fresh rally. The post-breakout rally could surge the price of the $8 psychological barrier.
- Bollinger Band: The narrow range of Bollinger Band indicates increasing volatility and an imminent breakout is close.
- Moving Average Convergence Divergence: A potential crossover of the MACD(Blue) and signal lines(orange) above the midline could bolster the buying pressure.
- Relative Strength Index: The daily RSI slope rising above 50% reflects the increasing bullish momentum among traders.
Recent Posts
- Price Analysis
XRP Price Set for New Volatility Cycle as CME Opens 24/7 Crypto Trade
XRP price hovered at $1.30 after gaining 1.66% over the past 24 hours. The move…
- Price Analysis
Is AI Draining Bitcoin Liquidity as IBIT Outflows Extend While Wall Street Flocks to Anthropic?
Bitcoin (BTC) price is down by 5.42% in seven days to trade at $73,693 today,…
- Price Analysis
Is Bitcoin Price Reacting More to War Risk Than Crypto News?
Bitcoin price returned to the macro spotlight on Friday as US-Iran tensions influenced crypto market…
- Price Analysis
Cardano Price Nears Death Cross Despite Whale Holdings at 9-Year High – Bearish Ahead?
Cardano (ADA) price is down 3.67% today, May 28, to trade at $0.23 at the…
- Price Analysis
How Low Can Ethereum Price Go?
Ethereum price fell below $2,000 on May 28, marking its first break under that level…
- Price Analysis
3 Reasons XLM Price is Up 14% Today, May 28, as Stellar Enters Wall Street
Stellar (XLM) price is up 14% today, May 28, to trade at $0.169 at the…