Bearish Pattern Lurking On Quant Coin Tease A Breakdown Below $87.3
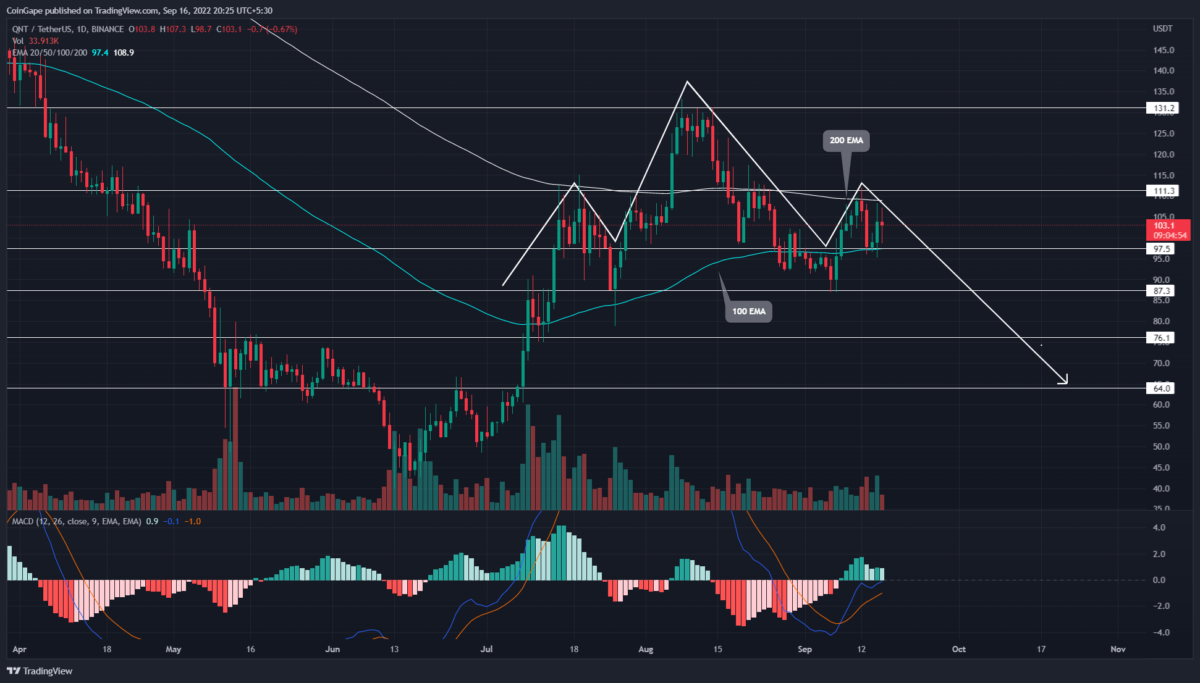
The Quant price daily technical chart shows a head and shoulder pattern formation. In theory, this pattern indicates a trend reversal where the price action shows higher high peaks shifting to lower lows. Thus, this pattern displays itself as a central swing high(Head) between the two shorter swing highs(shoulders).
Key points from Quant price analysis:
- With the influence of head and shoulder patterns, the Quant price could breakdown from $87.3 neckline support
- A breakout above the $111.3 resistance will invalidate the bearish thesis
- The intraday trading volume in the Quant is $49.5 Million, indicating a 77% gain
Amid the recent sell-off in the crypto market, September’s second-week recovery turned down from the 11.3 resistance, forming the right shoulder of the pattern. The downfall plunged the prices 12.5% lower to hit a local support zone of $97.5.
Furthermore, the formation of a bullish morning star candle pattern at this support offers an opportunity to offset the bearish pattern. However, the candle shows a long price rejection on both ends of the daily candle, indicating uncertainty among market participants.
Therefore, the Quant price is currently a make-or-break situation. A breakout from above $111.3 will undermine the bearish pattern and bolster buyers to rechallenge the swing high resistance of $131.2 resistance.
However, if the selling pressure persists, a breakdown below $97.5 will further encourage pattern completion. An $87.3 is the pattern’s neckline support, and a daily candle closing below it will extend the Quant price fall to the $64 mark.
Technical Indicator.
EMAs: the 100-day EMA aligned with $97.5 support and the 200-day EMA with $111.3 resistance gives more weightage to the short range and conditions mentioned above.
MACD indicator- The fast and slow lines wavering just below the neutral zone indicates the sellers still possess trend control. Moreover, the faded green bars in the histogram chart hint buying activities are weak.
Quant Price Intraday Levels
- Spot rate: $103
- Trend: Bearish
- Volatility: High
- Resistance level- $113 and $131.2
- Support levels- $97.5 and $87.3
Recent Posts
- Price Analysis
Top 3 Crypto Coins Near Their Lowest Levels This Month: BTC, ETH, and ADA
The crypto market fell 5.61% to $2.1 trillion as rate concerns pressured risk assets. Bitcoin…
- Price Analysis
Cardano Price Flashes Bottom Signal as 2022 Pattern Repeats Ahead of Crucial June 9 Governance Vote
Cardano (ADA) price has dropped below $0.16 for the first time since December 2020, and…
- Price Analysis
3 Ways to Think About SpaceX Before Its IPO
SpaceX submitted a confidential filing for an IPO on April 1, 2026, before making this…
- Price Analysis
PI Coin Price Could Be Very Different After June 8
Pi Coin price extended losses on Thursday as fresh unlock pressure weakened market confidence before…
- Price Analysis
MSTR Stock Crash Deepens as Strategy Hits Historic $10.8B Unrealized Loss
Strategy (NASDAQ: MSTR) has dropped by 26% since June 1, when it announced that it…
- Price Analysis
1 Reason XRP Price Could Surge in August
XRP price could see a surge in the upcoming month as traders watch fresh developments…