$28k Or $32k? Major Indicator Appears On Bitcoin Price Charts
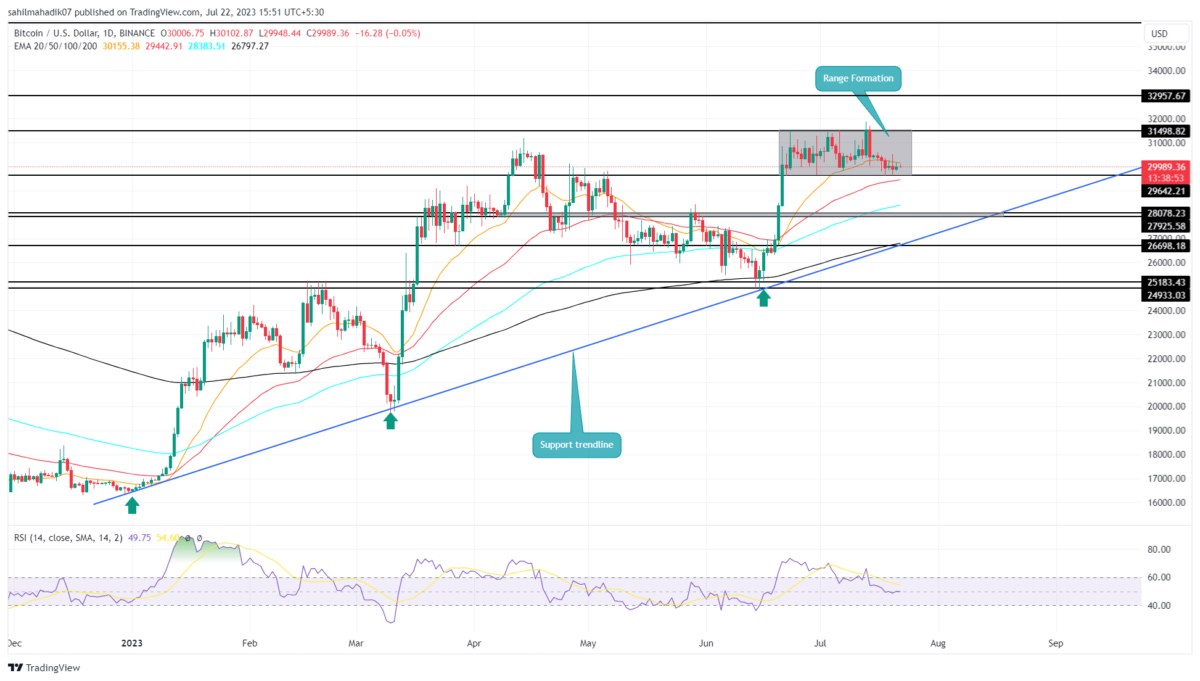
Bitcoin price is on a seesaw ride for the past month, swinging between $31,500 and $29,650. These levels have proven to be significant with Bitcoin price smacking into and bouncing back from both these levels three times. We’re seeing a ‘megaphone’ pattern emerge in this tug of war—a hint of growing volatility and a potential trend reversal.
So, are you planning to buy the dip or wait for more discounted prices? Check out Bitcoin price analysis to create a more technical viewpoint.
Also read: Bitcoin Long-Term Holders Reach ATH, Is The Time For Quick Gains Over?
Bitcoin Price Daily Chart
- The Bitcoin price, currently confined within a narrow range, requires a breakout opportunity to reestablish a directional trend.
- If a breakout occurs above $31,500, it could trigger a surge in the coin’s price, potentially resulting in a 4.5% increase.
- The intraday trading volume in Bitcoin is $10.5 Billion, indicating a 35% gain.
Bitcoin price action has entered a consolidation phase, trapped sideways after an impressive 21% surge in the last 15 days of June.
For almost 31 days, it has been hovering within a defined range, with $29,642 and $31,498 acting as the lower and upper bands respectively. This period of consolidation has bottled up significant momentum, potentially setting the stage for a sudden price shift upon breakout.
Currently, Bitcoin trades at $29,893 close to the support with signs of lower price rejection.
Moreover, an analysis of the closing price of each swing within the consolidation phase reveals a pattern of higher highs. Interestingly, similar observations can be made when examining the closing price of each bearish candle near the support band.
From these observations, it is evident that Bitcoin’s price action has formed a ‘megaphone’ pattern.
Will Bitcoin Price Crash After This Sideways Trend?
The Megaphone pattern projects increased uncertainty and volatility, hinting at a potential trend reversal. In essence, it forecasts a possible bearish reversal in Bitcoin price. However, the lower price rejection in Bitcoin prices suggests a potential bullish revival. This could lead to a new swing high within the consolidation phase, or possibly even a bullish breakout.
If a bullish breakout does occur, BTC price could reach a high of $32,957, based on range breakout projections. Conversely, should prices fail to sustain above the $29,642 mark, Bitcoin could fall as low as $27,925.
- EMAs: BTC price, supported at the 50-day EMA, hint at a high likelihood of a bullish reversal due to the emergence of a Morning Star pattern. Furthermore, in the critical view of the daily chart, the 200, 100, 50, and 20 EMA align in a bullish formation.
- Relative Strength Index: The RSI line indicates a bearish divergence during the consolidation phase. However, it finds support at the central line, suggesting a potential upside reversal.
Recent Posts
- Price Analysis
Why is Dogecoin Price Not Rising?
Dogecoin (DOGE) has gone down by 3.29% in just seven days to trade at $0.102…
- Price Analysis
XRP Price Prediction as CME Launches 24/7 XRP Futures Trading on May 29
XRP price remains stuck in a bearish trend after dropping by 2.9% in seven days…
- Price Analysis
Will Crypto Market Rise This Week?
The crypto market started the week with a cautious rebound, as traders returned to major…
- Price Analysis
Is Bitcoin Dead Again? 4 Reasons BTC Price Crashed to Below $75K
Bitcoin price crashed below $75,000 after intense selling pressure weakened sentiment across the broader cryptocurrency…
- Price Analysis
BMNR Stock Price Prediction as Tom Lee Says Bitmine Could Join Russell 1000
Bitmine Immersion Technologies (NYSE: BMNR) dropped by 3.72% on Friday, May 22, to $18. But…
- Price Analysis
Crypto Weekly Recap: Crypto Reserve Bill, Trump’s Executive Order, SpaceX IPO Explained, Hyperliquid Hits ATH
The crypto weekly recap for May 18 to May 23 shows an eventful week for…