Bitcoin Price Analysis: $BTC Price Back on Correction Path; Is $25000 Next Target?
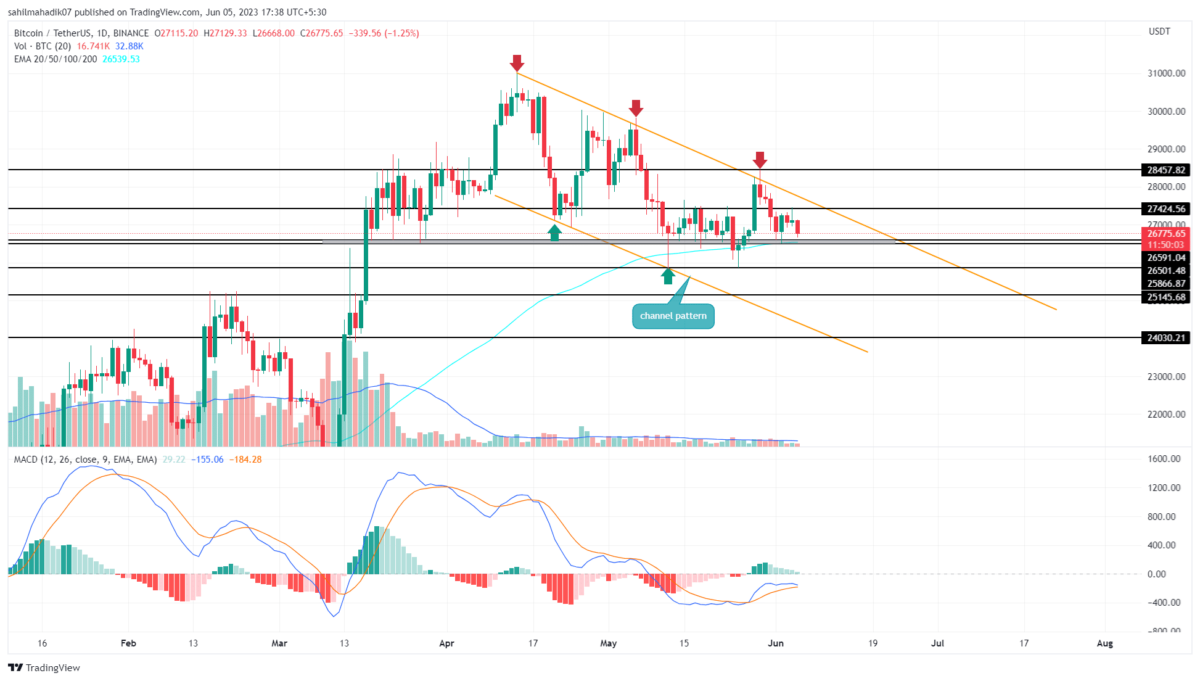
Bitcoin Price Analysis: The Bitcoin price witnessed a bearish reversal from the resistance trendline of the channel pattern on May 29th, indicating the buyers are not yet ready to start a recovery rally. From the reversal point, the BTC price plunged 5% over the week and currently exchange hands at $26749. The ongoing downfall may soon challenge another support level of $26500, which will validate if coin holders are going to lose more ground.
Also Read: Bitcoin (BTC) Accumulation Zone Identified, What’s Next for Price Growth?
Bitcoin Price Daily Chart
- Bitcoin Fear & Greed Index at 53% reflects a neutral sentiment in the market
- A breakdown below $26500 support will set the BTC price for a 5% drop
- The intraday trading volume in Bitcoin is $12.2 Billion, indicating a 40% gain.
A bearish reversal from the pattern’s resistance trendline has set the Bitcoin price for a bear cycle within the channel pattern. Ideally, this potential downfall could plunge the price back to the lower trendline which for BTC is around $24000.
As of now, the falling prices are approaching another significant support of $26600-$26500 in an attempt to breach below it. A successful flip of this support and resistance will provide sellers a solid barrier to pressurize the coin price lower.
With sustained selling, the Bitcoin price may plunge another 5% to hit $25000, followed by $24000.
Will Bitcoin Price Reclaim $27500 In June?
For Bitcoin price to expect a sustained recovery, it needs to breach the overhead trendline of the channel pattern. The potential breakout will be an early sign of trend reversal which could replenish the prior recovery rally. The first target of completing the pattern would be $28500.
- Moving Average Convergence Divergence: A bearish crossover between the MACD(blue) and signal(orange) line in the weekly chart signal additional confirmation for downtrend resumption.
- Exponential Moving Average: The 100-day EMA slope wavering near $26500 accentuates the importance of this level on ETH price.
Recent Posts
- Price Analysis
US CLARITY Act Countdown Start: Will BTC, ETH, XRP Rally?
Bitcoin (BTC), Ethereum (ETH), and XRP are under close watch as U.S. lawmakers accelerate progress…
- Price Analysis
CRCL, BMNR, COIN, MSTR Stocks Rise, What Analysts Predict Next?
CRCL, BMNR, COIN, MSTR Stocks moved higher on Wednesday as Bitcoin pushed closer to the…
- Price Analysis
Solana Price Prediction If Bitcoin Hits $80k in April 2026
Solana price remained steady above the $80 support zone, signaling resilience in the broader market…
- Price Analysis
Bitcoin and Ethereum 2026 Price Outlook After Trump’s Iran Diplomacy Ends
Bitcoin and Ethereum prices hovered at $66,552 and $1,998 on Wednesday following slight crypto market…
- Price Analysis
Will Pi Network Price Rally Ahead of April 6 Node Deadline as Protocol 21 Goes Live?
Pi Network Price is attempting a rebound as traders anticipate the April 6 node deadline…
- Price Analysis
Bitcoin and XRP Price Prediction as U.S. Senate Confirms April Markup for CLARITY Act
Bitcoin and XRP price action weakened despite the U.S. Senate confirming an April markup for…