Bitcoin Price Analysis: Bull Traps Puts $BTC Price at Risk of Prolong Correction
Affected by the massive growth of the 5th largest cryptocurrency XRP, the leading coin Bitcoin witnessed intense buying pressure on July 13th. With a strong bullish candle, the buyers breached the range resistance of $31500, luring awaited buyers for the potential of uptrend continuation. However, the buyers could sustain higher prices which lead to a massive red undermining the bullish thesis. What’s next?
Also Read: Bitcoin (BTC) Set For $35000, Ethereum (ETH) Above $2000 As US CPI Inflation Falls
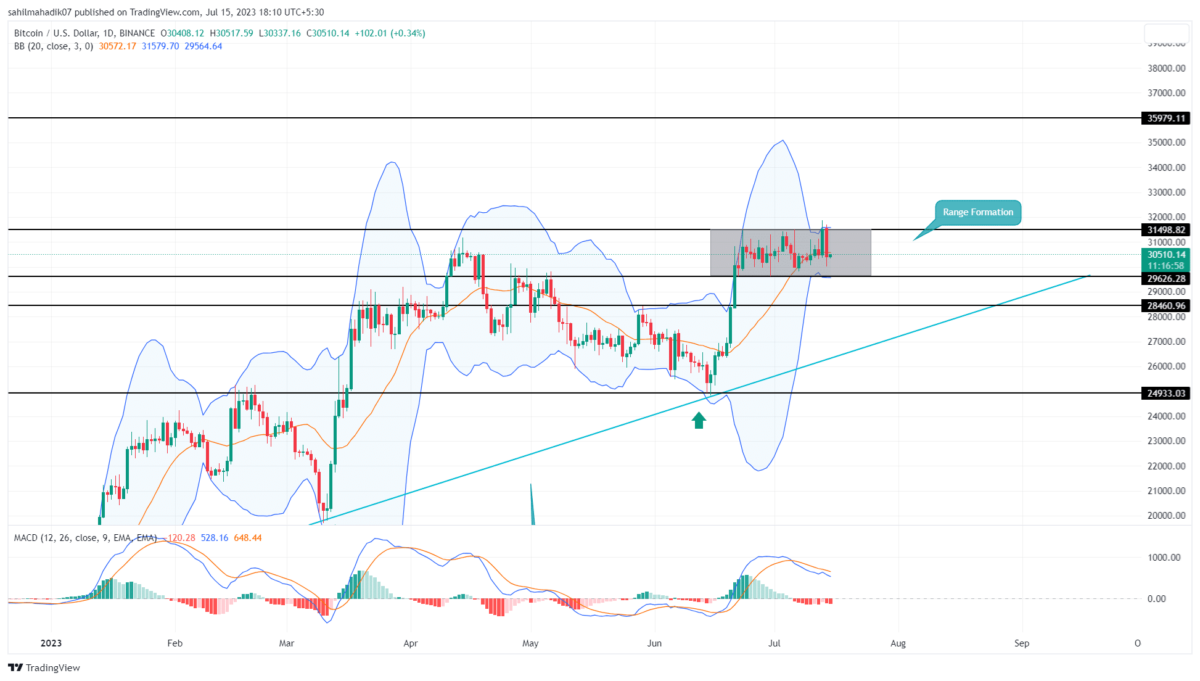
Bitcoin Price Daily Chart
- The $31500 level persists as a strong resistance zone for the BTC price.
- The 20-day EMA dynamic support maintains a high momentum recovery
- The intraday trading volume in Bitcoin is $17.3 Billion, indicating a 34% loss.
On July 14th, the Bitcoin price projected a long red candle that engulfed the buyer’s candle used to break the $13500 barrier. The sellers’ candles destroyed buyers’ weapons of breakout indicating a scenario of a bull trap which may flood more supply pressure as hasty buyers may get liquidated.
Thus, the coin price reenters the range boundaries stretched from $31500 to $29630. The Bitcoin price currently trades at $30461, but with sustaining selling it could plunge 2.75% to reach $29630 support
The price behavior at the aforementioned support would be crucial to check whether the prevailing recovery is intact, or whether BTC could witness a longer correction to $28460.
[converter id=”btc-bitcoin” url=”https://coingape.com/price/converter/btc-to-usd/”]
When BTC Price Can Escape the Sideways Trend?
The fake breakout from $31500 accentuated this level as a high supply zone. On the other hand, if the BTC price showed sustainability above $29630 in the coming days, the coin holders could witness a prolonged sideways trend. Therefore, a genuine breakout from either of the range pattern is needed to determine the near future trend for Bitcoin.
- Bollinger Bands: The upper and lower band of the BB indicator aligned with range levels gives extra weightage to them.
- Moving Average Convergence Divergence: The MACD indicator slope in a negative crossover state indicates the sellers actively influencing the Bitcoin price.
Recent Posts
- Price Analysis
Top 3 Crypto Stocks To Watch This Week: MSTR, BMNR, And CRCL
Crypto stocks remain in focus as investors monitor Bitcoin price, which holds $79,000 and Ethereum…
- Price Analysis
Pi Network Price Outlook Ahead of May 18 Protocol 23 Launch: Will PI Coin Rally?
Pi Network price hovered at $0.159 on Sunday ahead of the highly anticipated Protocol 23.0…
- Price Analysis
Bitcoin and XRP Price Prediction After Iran Launches “Hormuz Safe” — Will Crypto Rally on Rising Geopolitical Tensions?
Bitcoin and XRP prices remained under pressure as crypto markets struggled to recover from recent…
- Price Analysis
Top Crypto Stocks to Watch Ahead of May 20 FOMC Minutes – MSTR, COIN and CRCL
The Federal Reserve will release minutes for the April 28 FOMC meeting on May 20.…
- Price Analysis
Why is Bitcoin Price Down Today? (16 May)
Bitcoin price hovered below $78,000 on May 16 as crypto markets faced renewed selling pressure…
- Price Analysis
Crypto Weekly Recap: CLARITY Advances, US Inflation Soars, Wall Street Raises COIN Stock Target, Strategy Resumes Bitcoin Buys
The crypto market had a volatile week because the total market cap opened the week…