Bitcoin Price Eyes $32000 Mark after Clearing this Resistance
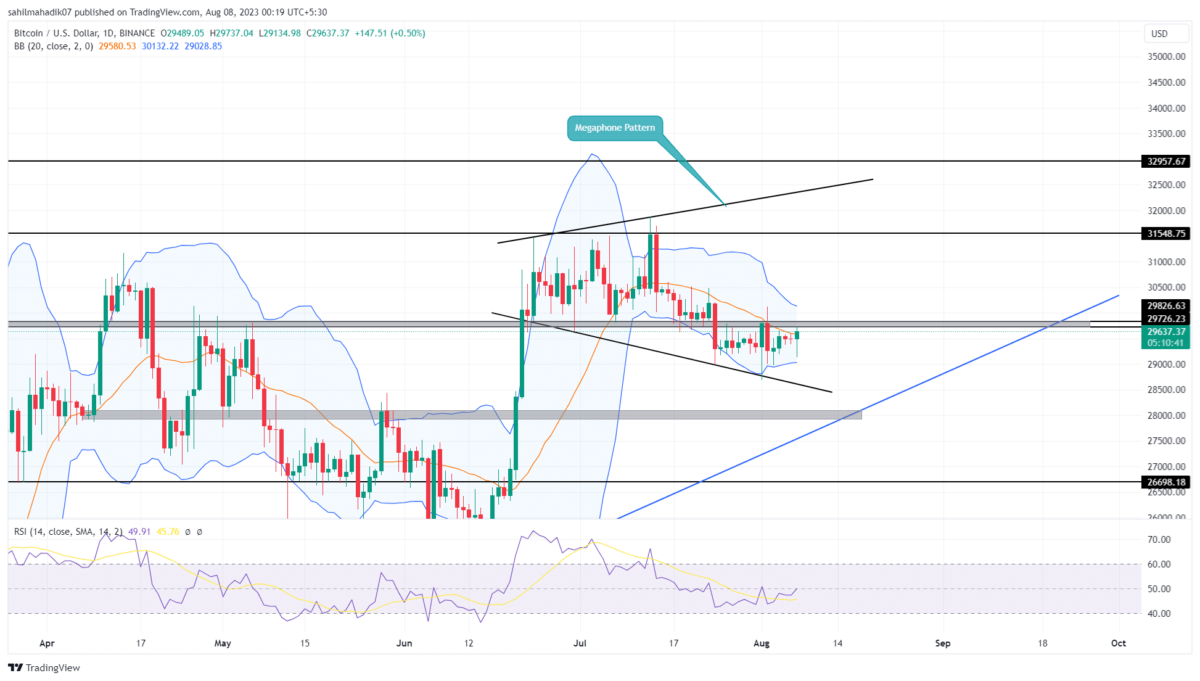
Over the past six weeks, the Bitcoin price showcases sideways action with no clear initiation from buyers or sellers. The short-body daily candles with long wicks on either side created a sentiment of uncertainty in the crypto market. Should you consider buying in the midst of increasing funds or selling now?
Also Read: New Bitcoin Addresses And Golden Cross Hints BTC Price Recovery
Bitcoin Price Daily Chart
- The megaphone pattern drives the current sideways action in Bitcoin
- The bottom support trendline could act as a strong accumulation zone for market buyers
- The intraday trading volume in Bitcoin is $12.6 Billion, indicating a 93% gain.
On July 24th, Bitcoin price experienced a bearish breakdown as it fell below the $29820-$29726 monthly. This move gave sellers an advantage, and the price seemed poised to drop another 4.5% to reach the next significant support at the ascending trendline.
The ascending trendline could act as strong support, as it carried sustained upward movement for the past seven months.
Interestingly, since the breakdown of the $29726, the price action has been moving sideways on the daily chart. Although the breakdown should have led to a significant downfall, the lack of strong selling pressure suggests that buyers are actively stepping in to support the price. This consolidation phase is an indication of weakness in the bearish momentum.
Therefore, despite the increasing uncertainty in the market, there is hope for a potential bullish recovery. Until this lower support trendline is intact, the coin holders can maintain their bullish outlook
[converter id=”btc-bitcoin” url=”https://coingape.com/price/converter/btc-to-usd/”]
Will BTC Price Rise Again?
There’s a possibility that the prior breakdown of $29726 was a bear trap, luring sellers into a false sense of security. If this scenario holds true, and buyers continue to support the price during this consolidation, it could lead to a bullish reversal. The increased buying pressure may drive Bitcoin price above the aforementioned level and potentially surge it above the $31000 mark.
- Bollinger Band: An upslope in the lower band on the Bollinger band indicator could offer additional support to traders.
- Relative Strength Index: The daily RSI slope rises above 50% hinting at the increased bullish momentum.
Recent Posts
- Price Analysis
Cardano Price Nears Death Cross Despite Whale Holdings at 9-Year High – Bearish Ahead?
Cardano (ADA) price is down 3.67% today, May 28, to trade at $0.23 at the…
- Price Analysis
Ethereum Price Crashes Below $2,000 for First Time Since March — How Low Can ETH Go?
Ethereum price fell below $2,000 on May 28, marking its first break under that level…
- Price Analysis
3 Reasons XLM Price is Up 14% Today, May 28, as Stellar Enters Wall Street
Stellar (XLM) price is up 14% today, May 28, to trade at $0.169 at the…
- Price Analysis
Pepe Coin Price Prediction as Bitcoin Crashes Below $75k
Pepe Coin Price held firm on Wednesday, as Bitcoin slipped below the $75,000 mark. PEPE…
- Price Analysis
Will XRP Price Rally Above $1.40 as XRPL Version 3.1.3 Goes Live?
XRP price remained under pressure on Wednesday, slipping 0.9% to trade near $1.33. However, the…
- Price Analysis
3 Reasons Pi Network Price Is Crashing Despite Ongoing Protocol Upgrades
Pi Network price has dropped by 19% since April 27, and it trades at $0.143…