BTC Price Prediction: Bullish Pattern in Play Hints 8.5% Jump Ahead
At the August end, the Bitcoin price witnessed a momentary surge of 10%, trying to restore recovery sentiment in the market. However, the momentum was short-lived as the price quickly retreated to the local support at $25500, extending its consolidation phase. Is this support enough to trigger a fresh recovery rally?
Also Read: BTC Price Short-Term Holders Capitulation Persists, 26% Drop On The Cards?
Bullish Chart Pattern Foretells Potential Upswing
- The technical chart projects the demand pressure at $25000 is active.
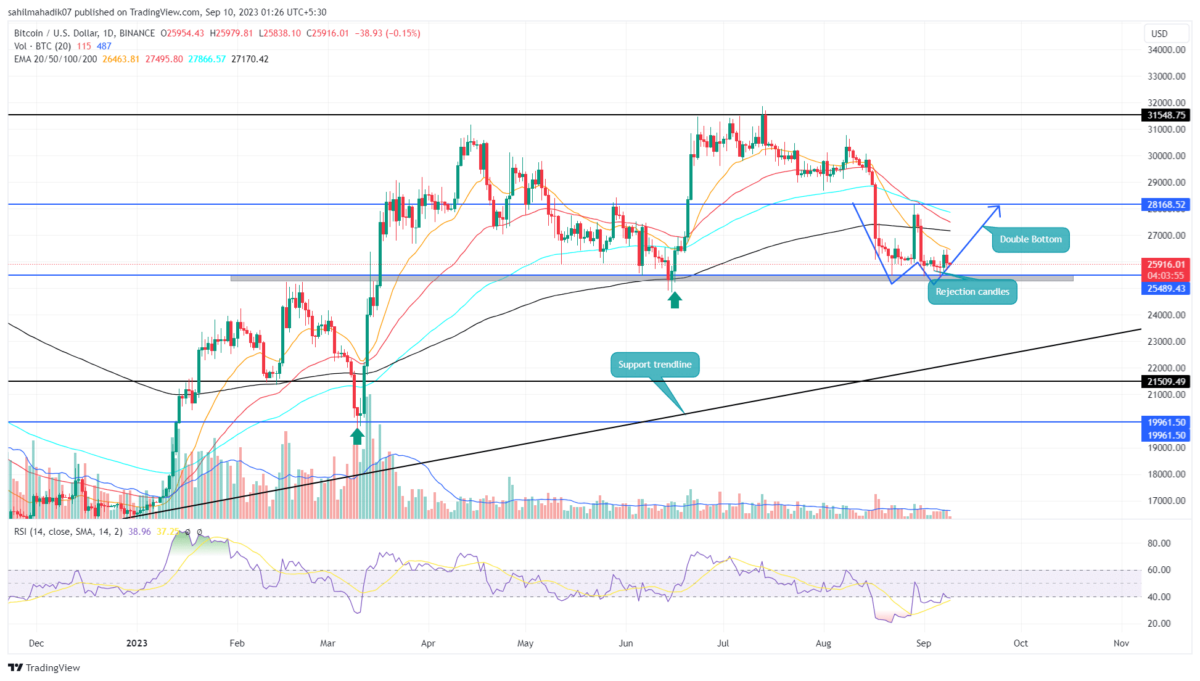
- A bullish breakout from the $28168 barrier will surge the coin price by 8.5%
- The intraday trading volume in Bitcoin is $5.9 Billion, indicating a 56.5% loss.
The daily time frame chart reflects multiple lower price rejection candles at $25500 support, indicating the buyers continue to defend this level.
Concerning this support, the technical chart suggests the possibility of a double-bottom formation. This chart setup is often spotted at the bottom of a downtrend, projecting an increase in demand pressure for a bullish reversal.
By the press time, the BTC price traded at $259006, with an intraday loss of 0.19%.
If the current pattern follows through, the buyers would likely break past the $28,168 neckline resistance. This breakout would be a better signal of a bullish recovery and may push the prices to $31,548.
[converter id=”btc-bitcoin” url=”https://coingape.com/price/converter/btc-to-usd/”]
Will BTC Price Lose $25500 support?
It’s also worth noting that despite experiencing multiple rejections at the $25,489 support, the buyers failed to establish a significant rebound. This reflects weakness in bullish momentum and the possibility of $25000. This breakdown will invalidate the aforementioned pattern and push the prices to the $24000 mark
Recent Posts
- Price Analysis
PI Coin Price Could Be Very Different After June 8
Pi Coin price extended losses on Thursday as fresh unlock pressure weakened market confidence before…
- Price Analysis
MSTR Stock Crash Deepens as Strategy Hits Historic $10.8B Unrealized Loss
Strategy (NASDAQ: MSTR) has dropped by 26% since June 1, when it announced that it…
- Price Analysis
1 Reason XRP Price Could Surge in August
XRP price could see a surge in the upcoming month as traders watch fresh developments…
- Price Analysis
Pi Network Price Loses Key Support as Retail Demand Fades Despite Surge in dApp Activity
Pi Network price is falling amid immense selling pressure that has pushed it below the…
- Price Analysis
Grok AI Predicts Chainlink Price in 2 Months
Grok AI predicts Chainlink price could recover over the next two months despite recent market…
- Price Analysis
Cardano Price Crashes to 2021 Lows as Charles Hoskinson Predicts ADA’s DeFi Collapse
Cardano (ADA) price remains under bearish pressure after dropping by 34% year-to-date to its lowest…