Can Chainlink Price Breakout from $7.7 Lead to Bigger Gains?
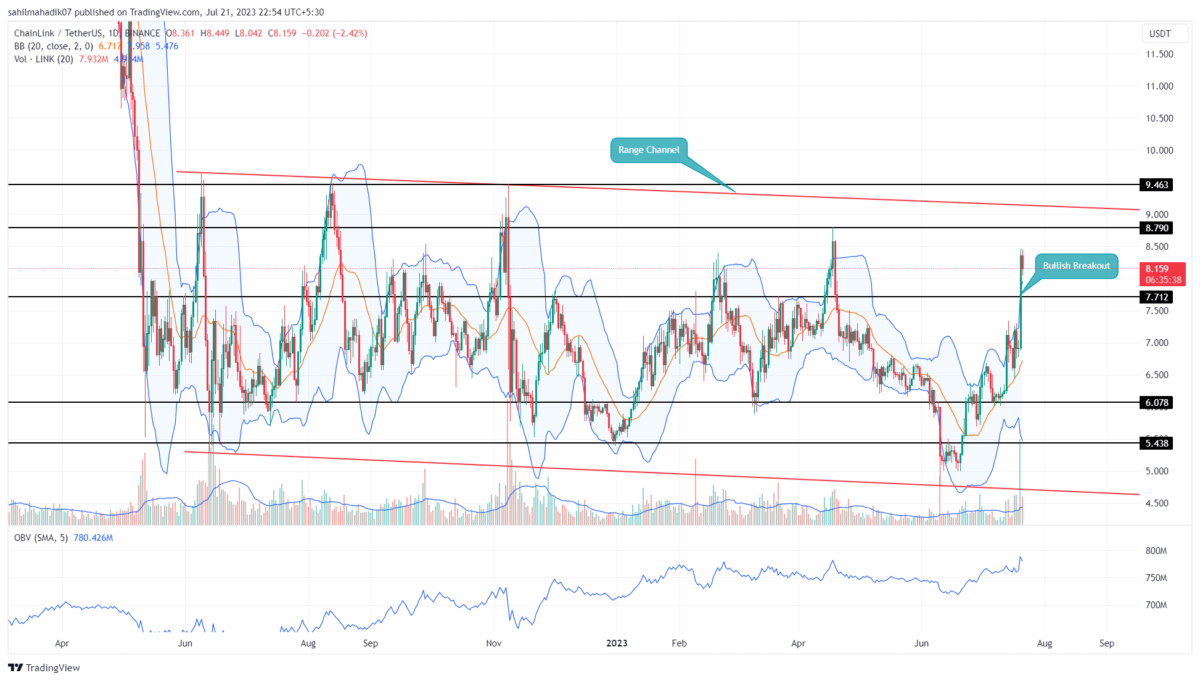
In the daily time frame chart, the chainlink price shows a V-shaped recovery from the $5 psychological support. So far, the bull run has recorded 62% growth and reached the current trading price of $8.144. Will buyers maintain the bullish momentum or the LINK price is poised for a minor correction?
Also Read: Chainlink (LINK) Price Pumps 20%, Expect further Price Rally As Whales Accumulate
Chainlink Price Daily Chart
- A potential pullback to $7.7 could offer a pullback opportunity to traders.
- The coin holders may witness a high supply zone at $9
- The intraday trading volume in the LINK coin is $814 Million, indicating a 22% gain.
For over a year, the Chainlink price has remained in a range-bound trend restricted between two converging trendlines. Amid this sideways move, the coin price has rebounded from both trendlines at least twice indicating the traders are under the strong influence of this channel pattern.
Furthermore, the ongoing recovery rally has recently breached a significant resistance of $7.7. After an explosive rally or breakout, the asset price tends to correct or retest the prior resistance as potential support.
If the chainlink buyers sustained these higher prices, the recovery rally could prolong another 10-12% higher to reach the combined resistance of $9 and overhead trendline.
Can LINK Price Break $9?
The overhead trendline is carrying a long-term sideways and therefore holds significant importance in technical charts. With sustained buying, the LINK price would soon hit the trendline barrier and probably witness strong supply pressure. While the overall market remains uncertain, it is less likely the coin price could build bullish momentum to break the $9 barrier. Therefore, the coin holders could witness a reversal or consolidation below the aforementioned resistance.
- Bollinger Band: The LINK price challenges the upper band of the Bollinger band indicator suggesting the market buying pressure is aggressive.
- On Balance Volume: The rising OBV slope indicates the buyer’s strong interest in a long position and therefore a sustained recovery in this cryptocurrency.
Recent Posts
- Price Analysis
Can Bitcoin and Ethereum Price Mirror the S&P 500 Rally as Trump Fuels Best Stock Market Returns?
The S&P 500 index has performed quite well this year and recently soared above 7,000…
- Price Analysis
TRUMP Meme Coin Price Prediction Ahead of Trump Crypto Conference Tomorrow
OFFICIAL TRUMP coin hovered at $2.89 on Friday ahead of President Donald Trump’s keynote appearance…
- Price Analysis
TSLA Stock Price Outlook as Stronger Than Expected Q1 Earnings Mask $173M Bitcoin Loss
Tesla (NASDAQ: TSLA) posted stronger-than-expected Q1 2026 earnings, driving a slight 0.28% gain in TSLA…
- Price Analysis
Is it Time to Exit XRP as CLARITY Act Passage Odds Hit a New Low?
XRP price has dropped by 2.4% today, April 23, after the odds of the CLARITY…
- Price Analysis
CRCL, BMNR, and COIN Stocks Price Prediction as CLARITY Act Hits April Roadblock
CRCL, BMNR, and COIN stocks moved higher as cryptocurrency markets extended their recent rebound. The…
- Price Analysis
Futures Data Signals XRP Price Breakout as $34B US Bank Opens XRP Deposits
XRP price has recorded an uptick in volatility today, April 22, with the price fluctuating…