Can Dogecoin Price Recliam $0.08 Mark Amidst Market Surge?
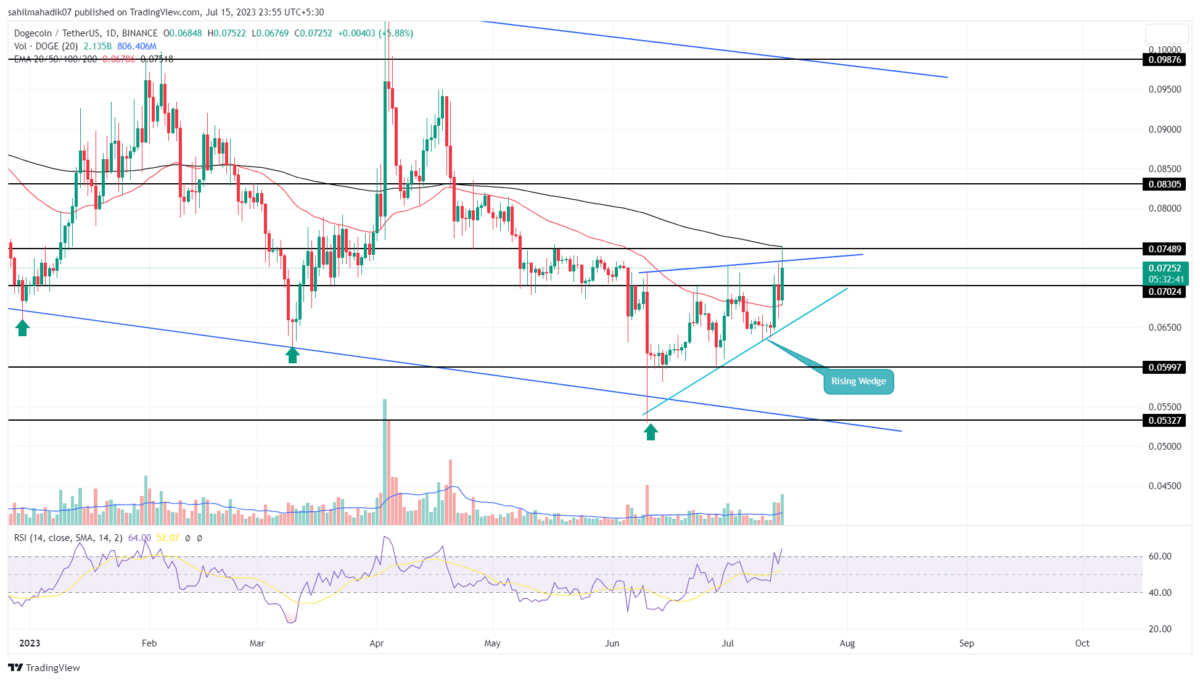
In the daily time frame chart, the Dogecoin price showed the formation of a rising wedge pattern. Using the pattern’s support trendline, this popular memecoin witnessed silent recovery in the past five weeks registering a growth of 37.6%. Will the chart setup lead to further growth in DOGE price?
Also Read: Dogecoin Price Analysis: Will $DOGE Buyers Hold $0.06 Support As Market FUD Rises?
Dogecoin Price Daily Chart
- A breakdown below the support trendline of the wedge pattern could tumble the $DOGE price by 20%.
- The recently reclaimed 50-day EMA bolsters buyers to prolong the current recovery
- The 24-hour trading volume in the Dogecoin coin is $941.6 Million, indicating a 26% gain.
Amid the recent recovery in the crypto market, the Dogecoin price managed to rechallenge the upper resistance trendline of the wedge pattern. In theory, this pattern is a downtrend continuation pattern that offers a resting period for sellers to regain strength.
Until the two trendlines of this pattern are intact, the asset price is likely to resonate within them and extend a minor recovery. By the press time, the DOGE price trades at $0.0723 and shows a rejection candle near the upper trendline.
A possible reversal from this overhead resistance may plunge the price back to a lower trendline. However, a breakdown below the support trendline is needed to complete this pattern which could potentially push the prices to the $0.053 mark.
Will Dogecoin Price Retake $0.75 High?
Considering the bullish sentiment in the market, the Dogecoin price may witness a rare-case scenario of surpassing the upper trendline. This bullish breakout with a daily candle closing will accelerate the bullish momentum and surge the memecoin 21% higher to hit $0.083.
Recent Posts
- Price Analysis
Bitcoin Price Prediction as JPMorgan Gives ‘Worst Case Scenario’ if US-Iran Ceasefire Fails
Bitcoin price held steady above the important support level of $72,000 today, April 10, as…
- Price Analysis
Why Is Trump Backed WLFI Token Price Dumping Today (10th April)?
The Trump family-backed World Liberty Financial (WLFI) price tumbled sharply over the past 24 hours…
- Price Analysis
BMNR Stock Eyes Rebound as it Boosts Share Buybacks 300% to $4 Billion
The BMNR stock price remains in a narrow range as the crypto market weakness continues.…
- Price Analysis
Bitcoin and XRP Price Prediction as Iran closes Strait of Hormuz again After Ceasefire Deal
Bitcoin and XRP prices on Thursday turned cautious as geopolitical tensions resurfaced and weighed on…
- Price Analysis
Pepe Coin Price Outlook After Canary Capital Files First PEPE Spot ETF
Pepe Coin Price hovered around $0.000003479, recording a weekly gain of nearly 5% after a…
- Price Analysis
BTC Price Eyes Recovery As Iran Adopts Bitcoin for Oil Transit Fees
Iran has required all the ships passing through the Strait of Hormuz to pay their…