Cardano Price Analysis: Will $ADA Price Lose $0.26 Support Amid Market Sell-off?
In the daily time frame chart, the Cardano price shows the formation of a double top pattern, a technical setup often seen before significant downward movement. With the peaks formed at the $0.30 mark, a breakthrough above this resistance could potentially ignite a strong bullish rally. However, the top forming in the chart reveals a potentially bearish phase ready to unfold.
Also Read: Cardano (ADA) Locked in DeFi Protocols Hits ATH
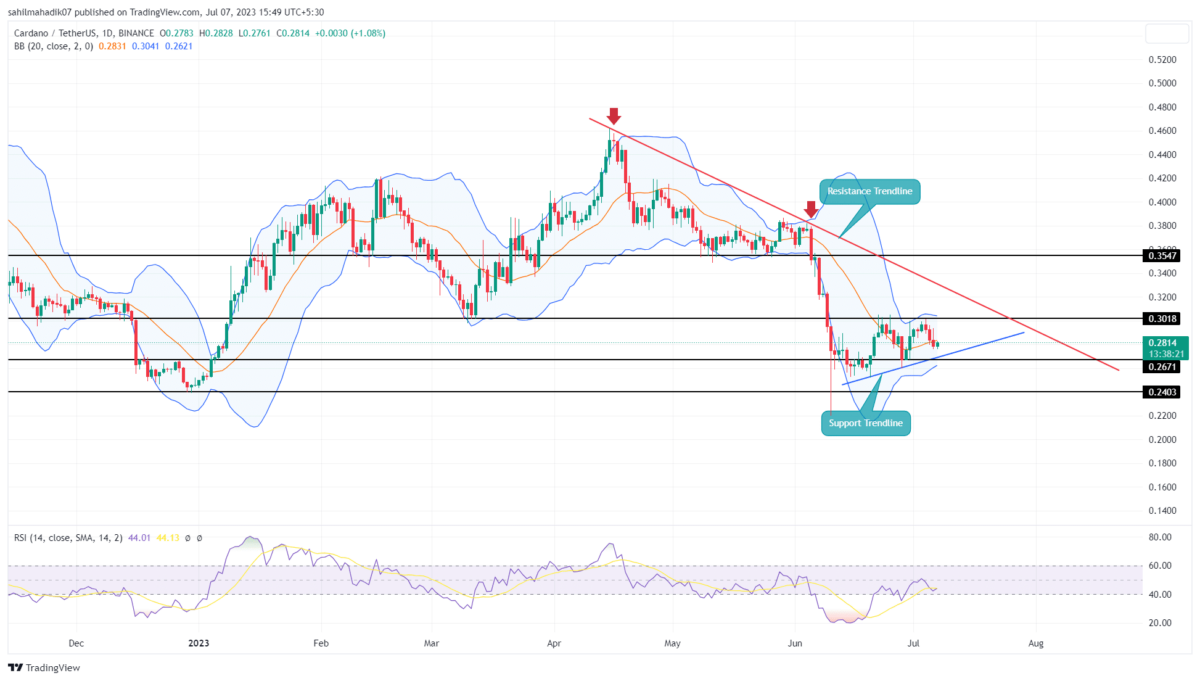
Cardano Price Daily Chart
- A breakdown below $0.26 could trigger a downfall in the ADA price
- The uptick in the lower Bollinger band along with daily gains reflects underlying bullish support.
- The intraday trading volume in the ADA coin is $232 Million, indicating a 13% loss
The Cardano price finds a gain of 1.79% after the three consecutive bearish candles that have shown a significant rejection of higher prices. Moreover, the chart suggests the formation of a double top pattern at $0.30 with a neckline at $0.26.
A short support trend line is also in action, a diagonal line drawn on the price chart connecting a sequence of low points. Interestingly, a long-standing resistance line is evident, persisting since the price failed to surpass $0.45. This creates a symmetrical triangle pattern in the daily chart.
If the price falls below this level, it could potentially reach $0.239. This level is critical to monitor, as a break below the neckline would confirm the double top pattern, indicating a bearish reversal.
Conversely, the formation of a bullish candle on the daily chart suggests a high likelihood of a sideways movement until the price reaches the resistance trend line.
Will ADA Price Sustain Above $0.26?
The formation of a double top in the Cardano coin reflects a bearish comeback as the profit booking after the short recovery accelerates the selling spree. This may eventually lead to an $0.26 breakdown. However, the 1.79% gain in the last 24 hours and the support trendline forming the triangle in the daily chart project a potential sideways trend in Cardano price until it reaches the resistance trendline.
- Bollinger Bands: A remarkable uptick in the lower band of the Bollinger Bands suggests a strong underlying bullish pressure, ready to absorb the double top breakout.
- Relative Strength Index: With the anticipated reversal, the daily RSI slope remains stagnant close to the halfway line, after an ascent from the oversold zone.
Recent Posts
- Price Analysis
Bitcoin and XRP Price Outlook Ahead of May 2026 CLARITY Act Roundtable
Bitcoin and XRP Price outlook remains positive as the global crypto market rose 1.26% to…
- Price Analysis
COIN Stock Price Prediction May 2026 as Lawsuits Weigh on Pre-Earnings Outlook
Coinbase (NASDAQ: COIN) soared by over 3% on April 30. That was a good close…
- Price Analysis
Here’s Why Terra Classic (LUNC) Price Jumped 60% This Week
This week the Terra Classic (LUNC) price spiked, generating considerable attention in the wider cryptocurrency…
- Price Analysis
Dogecoin Price Forecast as Open Interest Nears 4-Month High Amid $14M Whale Positioning
Dogecoin (DOGE) is out of a wedge, and it is showing that it is not…
- Price Analysis
Crypto Stocks Price Prediction: CRCL, BMNR, And MSTR as U.S.-Iran Blockade Persists
Crypto stocks price today, CRCL, BMNR, and MSTR, declined as market sentiment weakened across global…
- Price Analysis
Will XRP Price Reach $1.80 in May 2026 Amid Rakuten Integration?
XRP price might be headed for a bullish May because of a partnership that happened…