Ethereum Price Analysis: Bullish Pattern Sets the $ETH Price for 15% Rally
Ethereum Price Analysis: After a week-long of correction, the Ethereum price gave a decisive breakout from the downsloping resistance trendline of the flag pattern. This breakout backed by a spike in trading volume reflects the recuperated bullish momentum and the high possibility for the coin price to reclaim higher ground. Here’s how completing the chart pattern could prolong the bullish rally in ETH price.
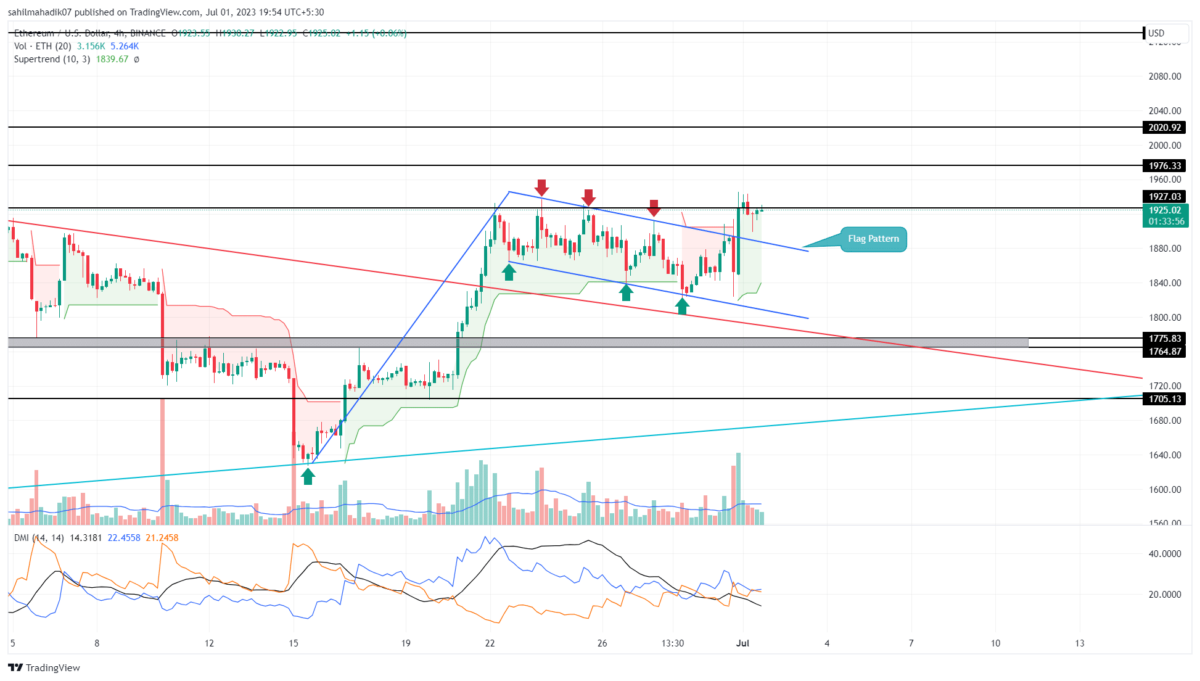
Ethereum Price Daily Chart
- A bullish breakout from the resistance trendline set the ETH price for a prolonged rally to $2212
- A possible breakdown below $1837 may set the coin’s market value by 4%
- The intraday trading volume in Ether is $7.5 Billion, indicating a 24% gain.
In theory, the Flag patterns are formed in an ongoing uptrend to provide buyers with a break period and stabilize the price action. A breakout above the pattern’s resistance trendline signals uptrend continuation and offers traders the opportunity to enter long trades.
Under the influence of this pattern, there are two potential targets for the Ethereum price. The first is the distance between the flag trendlines measured from the breakout point, and the second is the pole distance.
Therefore, with sustained buying, the ETH price could see a minimum growth of $1976 and a max rally of $2212.
Will Ethereum Price Prolong Bullish Recovery?
By the press time, the Ethereum price traded at $1926 with an intraday loss of 0.37%. However, the red candle today could be retested to flag a breakout, checking the sustainability of coin prices at higher levels. The long-lower price rejection candle indicates the buyers obtained suitable support from breached resistance, which could also assist them to rise above the $2000 mark.
- Supertrend: The Supertrend indicator converted back to green film indicates a positive trend sentiment among traders.
- Directional Movement Index: A bullish crossover between the DI+ slope(blue) and the DI- line(orange) reflects increasing buying pressure in the market.
Recent Posts
- Price Analysis
Dogecoin Prediction: DOGE Flips XRP in Trading Volume As Price Defends Two Year Support Level
Dogecoin (DOGE) price is up by 2% today, June 8, to trade at $0.086 at…
- Price Analysis
Ethereum isn’t dead’ – Analysts weigh in as ETH rebounds above $1,600
Ethereum price recovered back above $1600 on Monday after analysts said the asset was showing…
- Price Analysis
Dogecoin Price Prediction for Next Week Despite the June 12 SpaceX IPO
Dogecoin (DOGE) price is down 18% between June 1 and June 6 to trade at…
- Price Analysis
Crypto Feels Dead, Is a Recovery Possible? Here Are 3 Possibilities
The Crypto dead narrative has returned as the market faces another sharp downturn. Bitcoin is…
- Price Analysis
Monad Price: Where Will It Be in 1 Year?
Monad (MON) price has dropped by 57.6% since hitting an all-time high of $0.492 on…
- Price Analysis
Crypto Market Weekly: Bitcoin Retests 2024 Lows, MSTR Stock Crashes, Cardano’s Crisis and CLARITY Act Risk
The crypto market has seen a flurry of activities this week, but the one thing…