Ethereum Price Analysis: Will $ETH Bulls Regain Control at $1845 Support?
Ethereum Price Analysis: The Ethereum price reveals a recent downtrend in response to waning bullish momentum driven by participants of several US-based companies for Spot Bitcoin ETF. As the market leaders Bitcoin and Ethereum experienced a significant downsizing in the past week, the ETH market value tumbled 6% and reached $1845 locally. However, the current sideways movement between $1875 and $1845 indicates a critical range to watch as it can replenish a directional movement back to this altcoin.
Also Read: Bitcoin, Ethereum, USDT Trade At Discount On BinanceUS, Arbitrage Opportunity Or Trap?
Ethereum Price Daily Chart
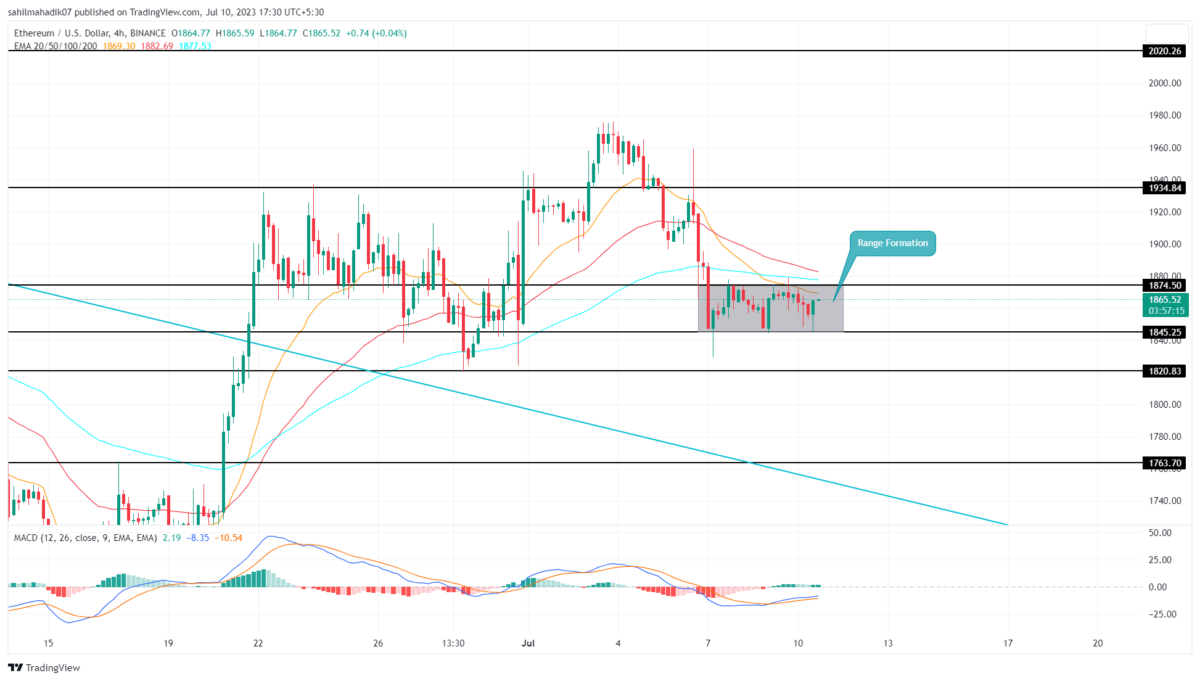
- The Ethereum price showcases a no-trading zone between $1875 and $1845
- The lower price rejection candle at $1845 reflects suitable demand pressure
- The intraday trading volume in Ether is $5.2 Billion, indicating a 32% gain.
The falling Ethereum price takes a sideways detour and creates a range between $1875 and $1845 horizontal levels. This range could be a temporary halt in the bearish march, allowing sellers to regain their strength.
The bearish pressure on Ether has the potential to intensify if the price breaks below the $1845 support level. Such a breakdown would provide sellers with an opportunity to exert further downward pressure, potentially causing the price to tumble by an additional 7%.
In this scenario, the price may find support around the $1720 demand zone, attracting buyers looking for potential opportunities to enter the market at a lower price point. The $1720 level aligned with a rising support trendline provides an opportunity to accumulate at a dip.
Can ETH Price Rise Back to $1934?
If the Ethereum price manages to sustain above the 1845 support associated with a 32.6% Fibonacci retracement level, the buyers could trigger a breakout above the $1875 resistance level. A breakout above this barrier, with a 4-hour candle closing could signify a shift in the market dynamics. Such a breakthrough would provide an opportunity for buyers to regain control and potentially drive the price toward the $1934 mark.
- Exponential Moving Average: The 4-hour EMAs(20, 50, 100, and 200) moving above the ETH price indicate multiple resistance against potential recovery.
- Moving Average Convergence Divergence: Despite a lower low formation in the MACD indicator, the price action maintaining a higher low indicates the sellers’ attempts are not causing a major effect.
Recent Posts
- Price Analysis
Why Analyst Warns Ethereum Price Could Revisit Its Lows if $1,700 Remains Unreclaimed
Ethereum price slipped deeper into the red as sellers tightened control across the broader crypto…
- Price Analysis
Cardano Price Prediction Ahead of June 23 Leios Testnet Launch
Cardano (ADA) price has made three green candles for the last three straight days as…
- Price Analysis
XRP Price Repeats Rare 2021 Pattern as XRPL Locked Supply Rises Ahead of June 15 Upgrade
Ripple (XRP) is repeating the same triangle pattern that it formed between April 2021 and…
- Price Analysis
Dogecoin Price Prediction Ahead of SpaceX IPO This Week
Dogecoin price is trading higher as traders watch renewed market interest before the expected SpaceX…
- Price Analysis
Analysts Predict Bitcoin Could Crash to This Price Next Week
Bitcoin price hovered at $63,259 on Tuesday after a mild rebound helped stabilize the wider…
- Price Analysis
Dogecoin Prediction: DOGE Flips XRP in Trading Volume As Price Defends Two Year Support Level
Dogecoin (DOGE) price is up by 2% today, June 8, to trade at $0.086 at…