Ethereum Price Analysis: Here’s Why Correction Phase Persists for ETH Price; Back to $1800?
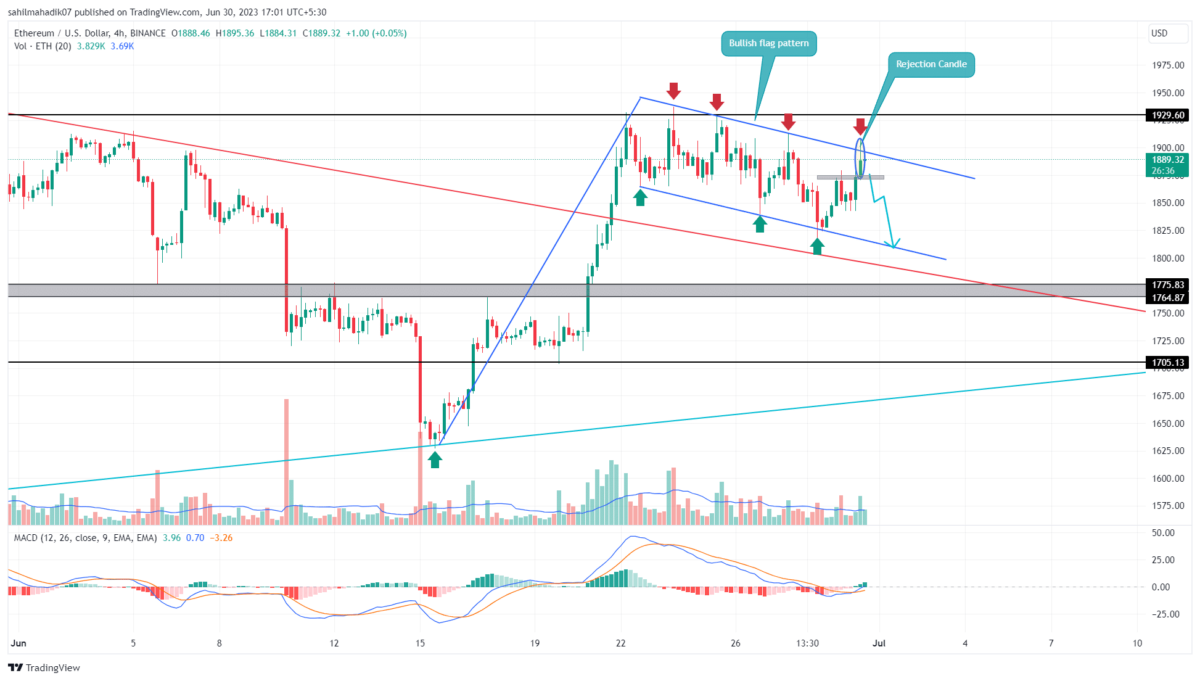
Ethereum Price Prediction: For over a week, the Ethereum price has been under a correction phase, during which it kept resonating between two downsloping trendlines of a flag pattern. Though, this pattern is a bullish continuation pattern, until the downsloping trendlines remain intact, the short-term trend for ETH will remain bearish. Currently, the coin price faces overhead supply pressure at a downsloping trendline indicating sellers may continue the downward trend.
Also Read: Big Options Expiry Stirs Mixed Bitcoin and Ethereum Price Action
Ethereum Price Daily Chart
- The rejection candle at the downsloping resistance trendline reflects a deeper correction in the ETH price
- A possible breakdown below $1837 may set the coin’s market value by 4%
- The intraday trading volume in Ether is $7.5 Billion, indicating a 24% gain.
During the mid-week, the Ethereum price projected a sharp reversal from the $1820 mark, which pushed the coin’s market value by 3.7%. The coin price currently trades at the $1886 mark and showed another failed attempt from the flag pattern.
In the 4-hour time frame chart, the ETH price showed a long-tail rejection at the resistance trendline indicating the overhead supply remains high. This rejection suggests a suitable possibility for a bearish reversal which may set the coin price for another 4% fall to hit $1800.
A 4-hour candle closed below the $1837 mark which is the low of the aforementioned rejection candle would give better confirmation for potential downfall.
Is Ethereum Price Ready to Hit $2000?
Under the influence of the flag pattern, the overall trend for Ethereum price remains bullish. Depending on the current sentiment of the market, the ongoing correction may prolong, but the buyers are poised to break the overhead trendline. A breakout above the resistance trendline will signal the continuation of the prior uptrend and more likely push the prices to $2000, followed by $2130.
- Exponential Moving Average: Amid the current correction, the 20-and-50-day EMA acted as an important pullback support.
- Moving Average Convergence Divergence: The MACD slope(blue) wobbling above the signal line(orange) reflects the overall trend as bullish.
Recent Posts
- Price Analysis
Dogecoin Prediction: DOGE Flips XRP in Trading Volume As Price Defends Two Year Support Level
Dogecoin (DOGE) price is up by 2% today, June 8, to trade at $0.086 at…
- Price Analysis
Ethereum isn’t dead’ – Analysts weigh in as ETH rebounds above $1,600
Ethereum price recovered back above $1600 on Monday after analysts said the asset was showing…
- Price Analysis
Dogecoin Price Prediction for Next Week Despite the June 12 SpaceX IPO
Dogecoin (DOGE) price is down 18% between June 1 and June 6 to trade at…
- Price Analysis
Crypto Feels Dead, Is a Recovery Possible? Here Are 3 Possibilities
The Crypto dead narrative has returned as the market faces another sharp downturn. Bitcoin is…
- Price Analysis
Monad Price: Where Will It Be in 1 Year?
Monad (MON) price has dropped by 57.6% since hitting an all-time high of $0.492 on…
- Price Analysis
Crypto Market Weekly: Bitcoin Retests 2024 Lows, MSTR Stock Crashes, Cardano’s Crisis and CLARITY Act Risk
The crypto market has seen a flurry of activities this week, but the one thing…