Ethereum Price Prediction: What’s Next, $1500 Or $1700?
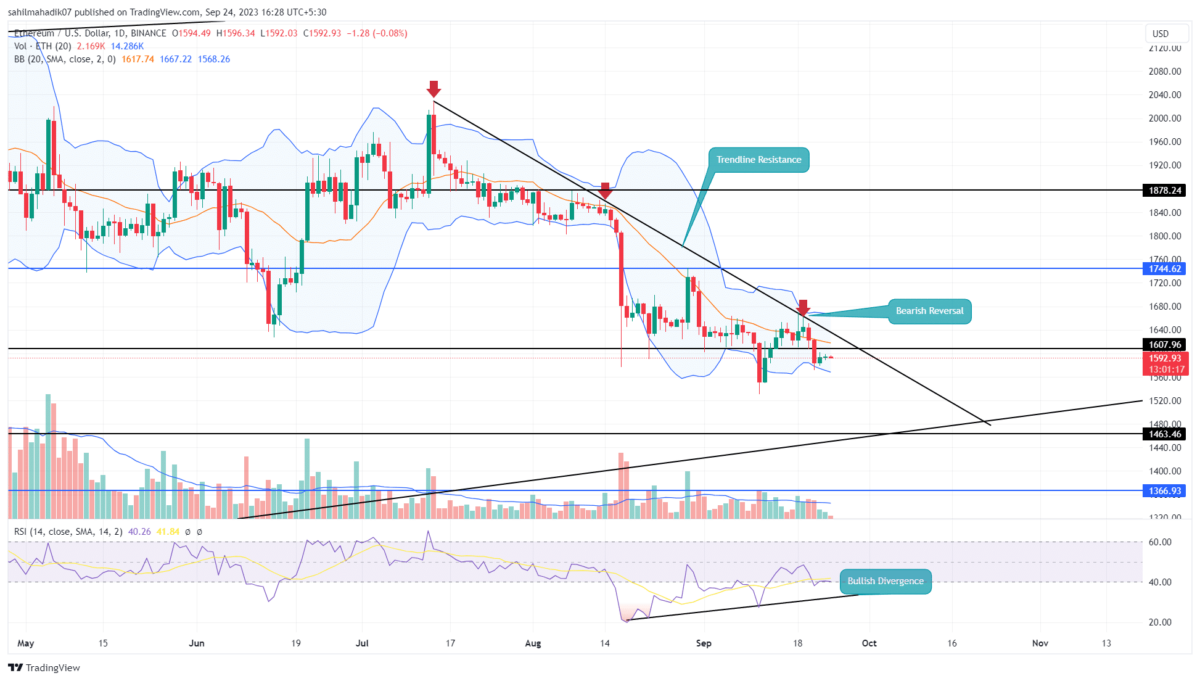
On September 19th, the rising ETH price faced a roadblock at the $1660 level and formed a bearish reversal pattern known as the “Evening Star.” This particular setback marked the third time Ether reverted from a downsloping resistance trendline that dictated its price trajectory for over two months. Given this consistent pattern, the ongoing downtrend looks set to persist, with potential further drop on the horizon.
Also Read: Ethereum Network Fees Hits Yearly Lows; Is the Bottom In?
Will Ether Rise Back to $1700?
- The ETH price faces dynamic resistance from a falling trendline.
- A breakdown below $1610 support sets a potential fall to $1500
- The intraday trading volume in Ether is $1.9 Billion, indicating a 33% loss
From last week’s high of $1669, the Ethereum price fell 4.5% to reach the current trading price of $1593. This descent breached the local support of $1610 projecting the sellers’ intent to drive the price down further.
Yet, the lack of a significant follow-through after this drop suggests a waning bearish momentum. Consequently, the coin sees a slight uptick, potentially retesting the overhead resistance trendline.
Should this occur, it provides buyers an opportunity to break this barrier, hoping to ignite a fresh recovery phase. This upside breakout with a daily candle closure, could propel ETH price value by around 8%, targeting the $1744 mark.
[converter id=”eth-ethereum” url=”https://coingape.com/price/converter/eth-to-usd/?amount=1″]
ETH vs BTC Performance
When analysing the past quarter’s price behaviour, the Ethereum coin appears to be underperforming when compared to the Bitcoin price. The recovery attempts by ETH bulls tend to be subdued, while the price corrections have been more pronounced. Given this pattern of price behavior, investors should approach with caution when adding new funds to this altcoin.
- Bollinger Band: A downtick in the lower boundary of Bollinger Band reflects the sellers are currently aggressive.
- Relative Strength Index: The daily RSI slope forming three consecutive higher lows indicates the rising bullish momentum.
Recent Posts
- Price Analysis
Top Crypto Stocks to Watch Ahead of May 20 FOMC Minutes – MSTR, COIN and CRCL
The Federal Reserve will release minutes for the April 28 FOMC meeting on May 20.…
- Price Analysis
Why is Bitcoin Price Down Today? (16 May)
Bitcoin price hovered below $78,000 on May 16 as crypto markets faced renewed selling pressure…
- Price Analysis
Crypto Weekly Recap: CLARITY Advances, US Inflation Soars, Wall Street Raises COIN Stock Target, Strategy Resumes Bitcoin Buys
The crypto market had a volatile week because the total market cap opened the week…
- Price Analysis
What’s Next for Dogecoin Price, Recovery or Another Drop?
Dogecoin price traded near $0.112 on Thursday after gaining more than 20% during the past…
- Price Analysis
Pi Network Price Prediction After Creator-Focused App Studio Upgrade
Pi network price remained under pressure on Friday as the broader cryptocurrency market continued consolidating…
- Price Analysis
Why Bitcoin Price Could Reach $88,000 Despite Rising Odds Of Fed Rate Hikes
Bitcoin (BTC) price might reach $88,000 because it is currently 11.2% lower than the ETF…