Here’s Why Cardano Price Could See 12% Upswing in Coming Week
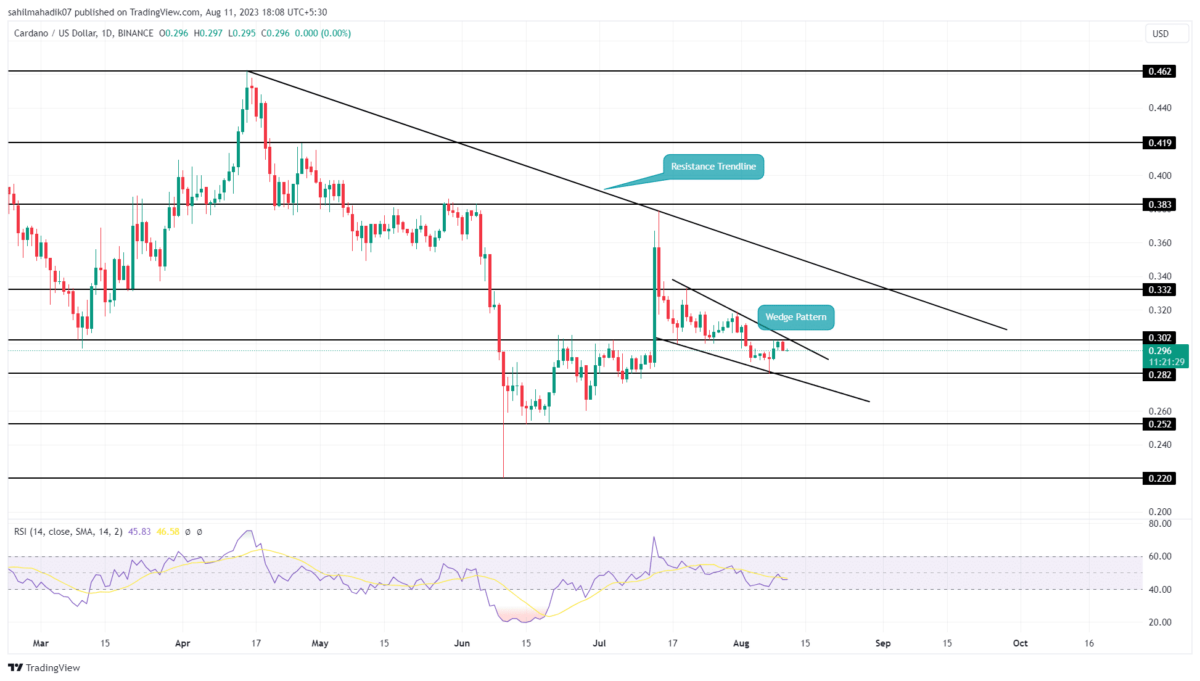
Eleven-month price action in Cardano coin indicates the ongoing trend in the technical chart is sideways. Amid this lateral movement, the prices project a short-term downtrend, evident by a downsloping trendline. On July 14th, the ADA price faced its latest reversal from the resistance trendline which led to a 22% drop and reached the current trading price of $0.296. Will correction extend or can buyers give a counted attack?
Also Read: Binance Delisting Cardano (ADA) And Polygon (MATIC), But There’s A Catch
Cardano Price Daily Chart
- The falling wedge pattern is often considered the end of a downward trend,
- A decisive breakout from the wedge pattern would set the ADA price for a 12% upswing
- The intraday trading volume in the ADA coin is $300.6 Million, indicating an 18% gain.
In the daily time frame chart, the falling Cardano price has shaped into a downsloping wedge pattern. This pattern consists of two converging trend lines that hint at a gradual weakening of selling momentum.
The above-mentioned pattern often results in a significant upswing upon the breakout of its resistance trendline. Currently, the ADA price trades at $0.286 and continues to wobble between the two falling trendlines.
The eight largest cryptocurrencies would continue this downfall until the wedge pattern barriers are intact. Thus, a potential breakout from the overhead trendline would signal a turning point, which could surge the prices by 10-12% and hit the long-coming resistance trendline.
[converter id=”ada-cardano” url=”https://coingape.com/price/converter/cardano-to-usd/?amount=1″]
Can ADA Price Trigger a New Recovery Cycle?
While the anticipated upswing could bolster buyers by 10%, the short-term will remain bearish until the downsloping trendline persists. For buyers to trigger a bull cycle with a long-term sideways trend, the coin price needs to give a daily candle closing above the trendline resistance which could accurately determine the underlying bullish momentum.
Recent Posts
- Price Analysis
Most Undervalued Crypto Coins to Watch This Week: SUI, ONDO, and Pi Network
The crypto market stayed volatile this week, with Bitcoin hovering at $73,500 as the U.S.…
- Price Analysis
Crypto Market Weekly: Bitcoin ETF Outflows Persist, Ethereum Enters Bearish Range, and XRP Spot Bids Surge
Crypto market prices have shed $150 billion in market cap in the six days leading…
- Price Analysis
XLM Price Gains 30% as Institutional Adoption Narrative Strengthens With DTCC Deal
XLM Price surged to $0.2443 as Stellar gained strong market attention after DTCC’s latest tokenization…
- Price Analysis
Coinbase Rattles $4.8T JPMorgan as COIN Stock Price Gains on Deeper TradFi Push
Coinbase (NASDAQ: COIN) stock closed trading at $189 on May 29 after rising by 3.72%…
- Price Analysis
XRP Price Set for New Volatility Cycle as CME Opens 24/7 Crypto Trade
XRP price hovered at $1.30 after gaining 1.66% over the past 24 hours. The move…
- Price Analysis
Is AI Draining Bitcoin Liquidity as IBIT Outflows Extend While Wall Street Flocks to Anthropic?
Bitcoin (BTC) price is down by 5.42% in seven days to trade at $73,693 today,…