Here’s Why Ethereum Could Rally 10% Before Continuing Its Downfall
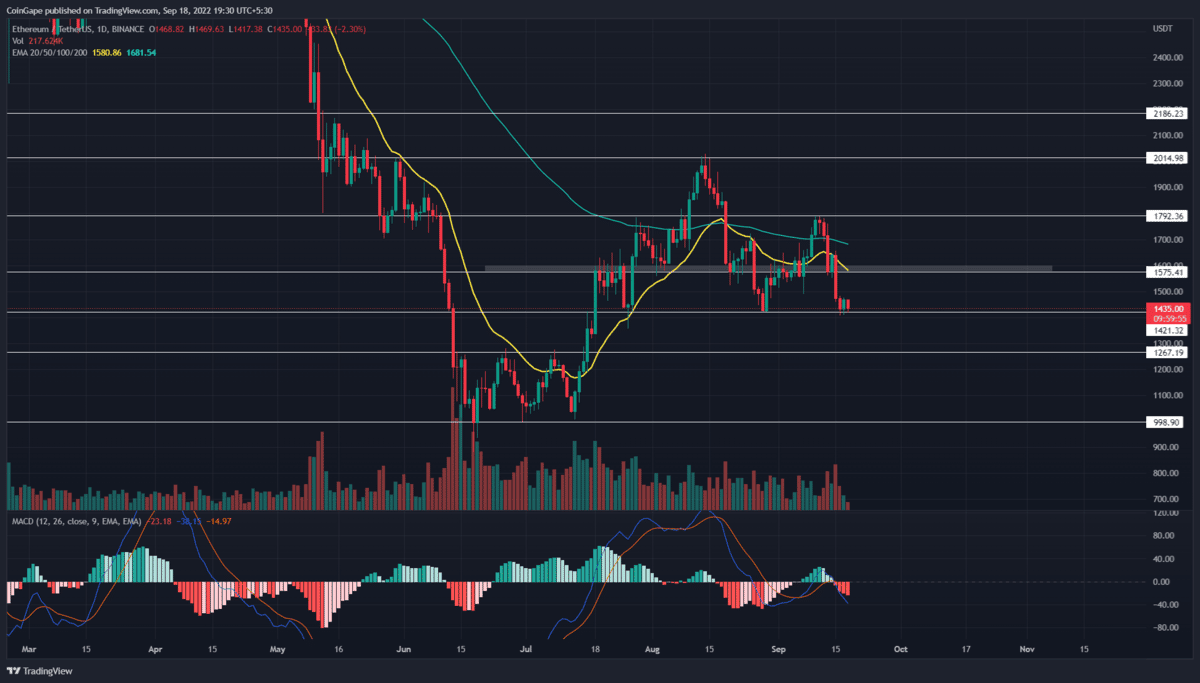
The recent widespread correction in the crypto market reverted the Ethereum price from $1800 resistance. This sell-off entirely evaporated the early September recovery and plunged the prices back to the monthly support zone of $1420. However, the price action shows reversal signs at this support, indicating a possible relief rally.
Key points:
- The coin chart shows the formation of a double bottom pattern in the 4-hour time frame chart.
- Losing the $1420 could plummet the Ethereum price bac
- The intraday trading volume in Ethereum is $10.65 Billion, indicating a loss of 12.2%.
Furthermore, it’s been three days since the sellers are wrestling buyers at this support to prolong this correction. Furthermore, with a 2.575% loss, the Ethereum price is painted red today and retests the $1420 support.
If the sellers manage a daily candle closing below the aforementioned support, the accelerated selling pressure will plunge the altcoin to $1000 psychological support.
Ethereum Could Rally With This Double Bottom Pattern
The four-time chart shows a lower price rejection candle at the $1420 support indicating the traders are actively buying at this level. Moreover, the RSI indicator displaying bullish divergence to base support indicates a better possibility for price reversal.
If this theory worked out, the Ethereum price could rally 3.88% higher to challenge the $1470 neckline of double bottom pattern. A bullish breakout from this resistance will further encourage buying activity and retest the $1575 supply zone.
Anyhow, the price action at this level is crucial to influence future Ethereum prices.
Due to the accumulation of daily EMAs at this level, a possible reversal could display a lower high in the daily chart indicating a losing bearing momentum.
However, if the Ethereum price surpasses this level, it indicates the recent correction was just panic selling in the market.
Technical indicator-
Bollinger band: the falling Ethereum price retest the indicator’s band support. Such activity has previously resulted in a bullish reversal, bolstering the relief rally theory.
MACD indicator: A widespread between the bearishly aligned fast and slow line below the neutral zone indicates aggressive selling in the market.
- Resistance level- $1470 and $1520
- Support level- $1400 and $1362
Recent Posts
- Price Analysis
How High Will XRP Price Go After CME Adds Ripple to NASDAQ Crypto Index on June 8?
XRP price had surged by 2.85% at the time of writing to trade at $1.47,…
- Price Analysis
MSTR Stock Price as Peter Schiff Warns STRC Is Draining Bitcoin Demand After Record 5M Volumes
Strategy (NASDAQ: MSTR) stock price closed trading on May 13 at $178 after dropping by…
- Price Analysis
Bitcoin and Ethereum price Outlook Ahead of U.S. Senate Banking Committee Vote on the CLARITY Act Today
Bitcoin and Ethereum price Outlook remained under pressure on Thursday as traders watched the U.S.…
- Price Analysis
3 Reasons Why Dogecoin Price is Up Today Despite Crypto Market Crash
Dogecoin (DOGE) has risen by 22% in just one month, and at the time of…
- Price Analysis
Will Cardano Price Rally as Hoskinson Confirms Revised CLARITY Act Recognizes ADA’s Non-Security Status?
Cardano (ADA) has increased by 11% since May 2026 started. These gains have come from…
- Price Analysis
XRP Price Prediction as XRPL Whale Wallets Hit Record High Ahead of Lending Protocol Update
XRP price touched $1.50 on May 10, and it might go back here or even…