Here’s Why XRP Price Could Extend Correction Trend; Back to $0.6?
For over a week, the XRP price resonated in a narrow sideways trend limited between two converging trendlines. This consolidation came after a massive rally on July 13th and was meant to stabilize the price trend and prolong the bullish trend. However, a breakdown from the pattern’s support trendline indicates, the 4th largest cryptocurrency would need longer correction.
Also Read: XRP Price Plummets 5% in 24 Hours – Is This The End of The Road for Bulls?
XRP Price Daily Chart:
- A support trendline breakdown set the XRP price for a 10% drop
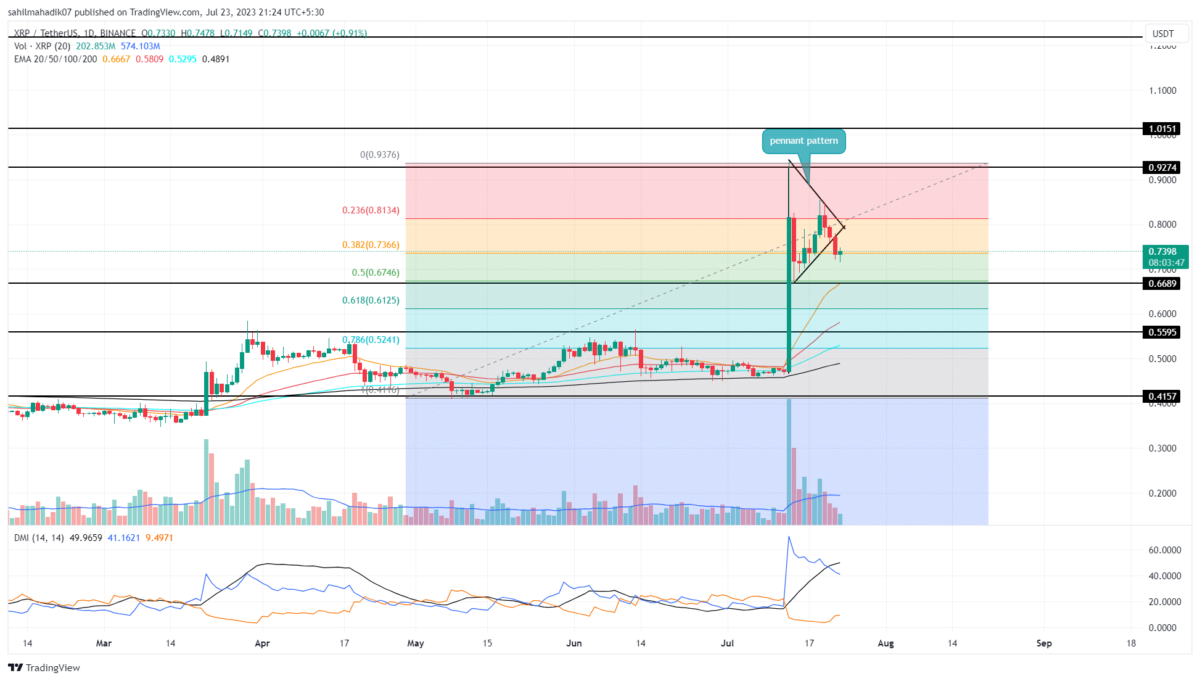
- The $0.669 support stands as a strong demand zone for the XRP price
- The intraday trading volume in the XRP is $1.87 Billion, indicating a 27% gain.
In the 4-hour time frame chart, the XRP price showcased the recent consolidation as the formation of a pennant pattern. However, on July 22nd, the coin price gave a bearish breakdown from the pattern’s support trendline.
A bearish outcome from a bullish pattern is a strong sell signal indicating a potential downfall in the near future. By the press time, the XRP price trades at $0.74 with a gain of 1.32%. This bullish uptick could retest the breached trendline to check price suitability for lower prices.
This post-breakdown fall could tumble this altcoin market value 9.5-10% down to hit $0.669.
Will XRP Price Plunge Back to $0.6?
The XRP price potential downfall to $0.669 would face strong support as aligned with the 50% Fibonacci retracement level. In technical analysis, a correction of 50% is still considered healthy and suitable to resume the prevailing bullish. However, a breakdown from this support plunged the price by 8.6% and tested the combined support of $0.6 and 61.8% FIB.
- Exponential Moving Average: The 20-day EMA at $0.669 increases the support strength of this level.
- Directional Movement Index: A significant gap between the positive crossover state of the DI+(blue) and DI-(orange) slope indicates the bullish momentum is intact.
Recent Posts
- Price Analysis
US CLARITY Act Countdown Start: Will BTC, ETH, XRP Rally?
Bitcoin (BTC), Ethereum (ETH), and XRP are under close watch as U.S. lawmakers accelerate progress…
- Price Analysis
CRCL, BMNR, COIN, MSTR Stocks Rise, What Analysts Predict Next?
CRCL, BMNR, COIN, MSTR Stocks moved higher on Wednesday as Bitcoin pushed closer to the…
- Price Analysis
Solana Price Prediction If Bitcoin Hits $80k in April 2026
Solana price remained steady above the $80 support zone, signaling resilience in the broader market…
- Price Analysis
Bitcoin and Ethereum 2026 Price Outlook After Trump’s Iran Diplomacy Ends
Bitcoin and Ethereum prices hovered at $66,552 and $1,998 on Wednesday following slight crypto market…
- Price Analysis
Will Pi Network Price Rally Ahead of April 6 Node Deadline as Protocol 21 Goes Live?
Pi Network Price is attempting a rebound as traders anticipate the April 6 node deadline…
- Price Analysis
Bitcoin and XRP Price Prediction as U.S. Senate Confirms April Markup for CLARITY Act
Bitcoin and XRP price action weakened despite the U.S. Senate confirming an April markup for…