Is LUNC Price Set for $0.00009? Triangle Pattern Signals a 10% Rise Ahead
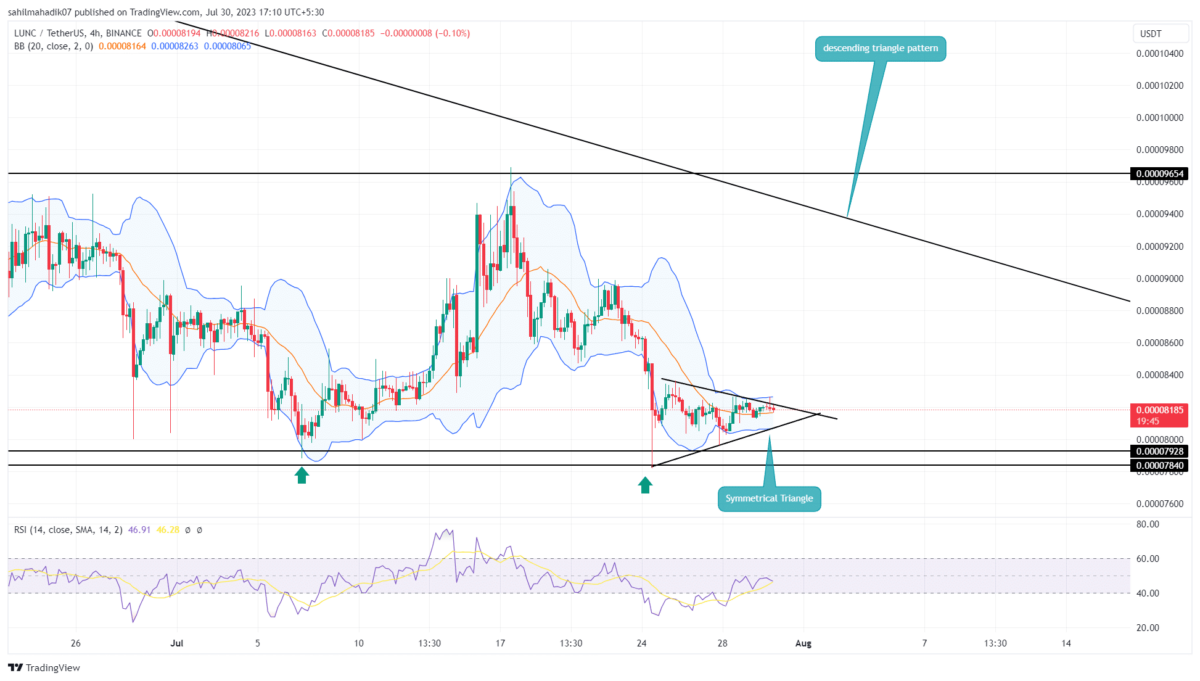
Amidst a prevailing bearish sentiment in the crypto market, the LUNC price witnessed a corrective phase over the past two weeks. Starting from its peak of $0.0000968, the coin has experienced a significant 15% decline, settling at its current trading price of $0.0000818. However, the price trend turned sideways after hitting the bottom demand zone of $0.0000793 and $0.000078. This consolidation reflects uncertainty among the market participants and questions the possibility of a bullish reversal.
Also Read: Expert Predicts 400% Jump For Terra Classic (LUNC) Price; Here’s Timeframe
LUNC Price Daily Chart
- The narrow range between the triangle pattern can be considered a no-trading zone
- A bullish breakout from the triangle pattern will set the LUNC price at a 10% Jump
- The intraday trading volume in the LUNC coin is $13.9 Million, indicating a 14% loss.
A closer look at the four-hour time frame chart shows the ongoing consolidation has shaped into a symmetrical triangle pattern. This pattern is characterized by a series of lower highs and higher lows, which create converging trendlines, giving the appearance of a triangle.
By press time, the LUNC price is trading at $0.0000819 and is steadily approaching the peak of the symmetrical triangle pattern. The fact that the price range has become narrower indicates that the coin price is about to experience a significant breakout.
If the coin price gives a bullish breakout from the overhead trendline, the crypto holders could witness a bullish reversal in a higher timeframe chart. This potential reversal has the potential to surge the price by as much as 10%, effectively challenging the overhead resistance trendline.
Will LUNC Price Plunge Back to $0.00007?
The symmetrical triangle pattern usually encourages the continuation of prevailing trends. Therefore a breakdown of this support line of the triangle pattern could encourage sellers to break the multi-month bottom support of $0.0000793 and $0.000078. The post-breakdown fall could tumble are altcoin to $0.00007.
- Relative strength index: A significant rise in the daily RSI slope indicate the increasing buying pressure at the bottom support and a higher possibility of an upside breakout
- Bollinger band: The narrow range of the Bollinger band indicator reflects a highly volatile phase in LUNC price.
Recent Posts
- Price Analysis
Cardano Price Nears Death Cross Despite Whale Holdings at 9-Year High – Bearish Ahead?
Cardano (ADA) price is down 3.67% today, May 28, to trade at $0.23 at the…
- Price Analysis
Ethereum Price Crashes Below $2,000 for First Time Since March — How Low Can ETH Go?
Ethereum price fell below $2,000 on May 28, marking its first break under that level…
- Price Analysis
3 Reasons XLM Price is Up 14% Today, May 28, as Stellar Enters Wall Street
Stellar (XLM) price is up 14% today, May 28, to trade at $0.169 at the…
- Price Analysis
Pepe Coin Price Prediction as Bitcoin Crashes Below $75k
Pepe Coin Price held firm on Wednesday, as Bitcoin slipped below the $75,000 mark. PEPE…
- Price Analysis
Will XRP Price Rally Above $1.40 as XRPL Version 3.1.3 Goes Live?
XRP price remained under pressure on Wednesday, slipping 0.9% to trade near $1.33. However, the…
- Price Analysis
3 Reasons Pi Network Price Is Crashing Despite Ongoing Protocol Upgrades
Pi Network price has dropped by 19% since April 27, and it trades at $0.143…