Key Levels to Watch as ETH Price Enters Consolidation Mode
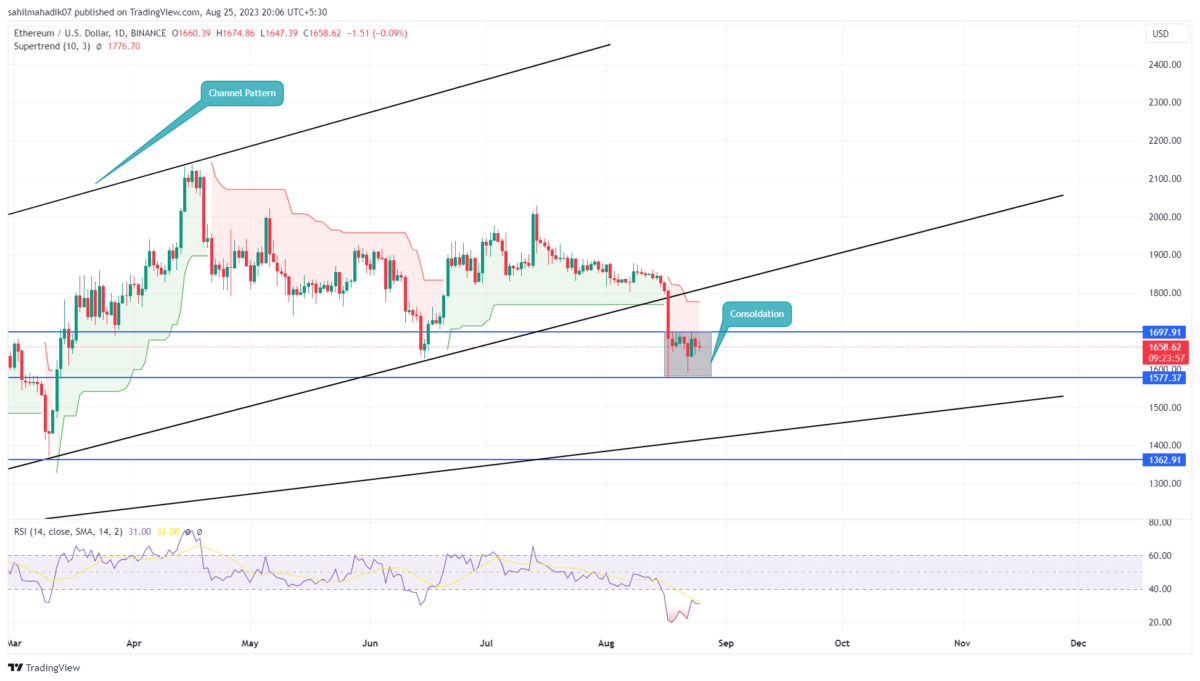
After a considerable sell-off in the first half of August, the crypto market has been witnessing high volatility. For over a week, the daily chart showed multiple short-bodied candles in the top two cryptocurrencies, Bitcoin and Ethereum reflecting an uncertain market sentiment. However, Amid this indecisiveness, the ETH price wobbling between two horizontal levels reflects the formation of range bound pattern which could assist in predicting near-future projections
Also Read: ETH 2.0 Deposits Hit ATH As Perpetual Futures Open Interest Dips
Ethereum Daily Chart: Key Points
- The area between the $1700 and $1577 horizontal level can be considered a no-trading zone.
- A bullish breakout from $1700 could trigger a 6.5% upswing in ETH price
- The intraday trading volume in Ether is $5.2 Billion, indicating a 15% loss.
Over the past eight days, the Ethereum price has resonated between creating a narrow range in the daily time frame chart. This consolidation came after a significant fall indicating the sellers must be recuperating the exhausted bearish momentum to resume the previous fall.
By the press time, the second largest cryptocurrency traded at $1660 with an intraday loss of 0.27%. If the bearish market sentiment continues, the coin sellers may rechallenge the bottom support of $1577.
A potential breakdown from this support will hint at the resumption of the downward trend and may push the prices to the $1500-1450 demand zone. In addition, the falling prices may also meet a rising trendline at the aforementioned support, indicating a higher possibility of a bullish reversal.
[converter id=”eth-ethereum” url=”https://coingape.com/price/converter/eth-to-usd/?amount=1″]
Can ETH Price Reclaim $1700 Mark?
As earlier reported by Coingape, the Ethereum price is witnessing increased whale activity near the $1650 mark. The presence of high accumulation from below may bolster buyers to challenge the $1700 resistance. A bullish breakout from this barrier will trigger a bullish pullback in a downward trend which could push the price back to $1800. However, until the buyers break above the August 17th high of $1809, the bearish outlook will remain intact.
- Relative Strength Index: The daily RSI slope rising above the oversold region accentuates the rising buying pressure from traders.
- Supertrend: A red paint projected in the daily chart reflects a negative trend in the market.
Recent Posts
- Price Analysis
Top Crypto Stocks to Watch Ahead of May 20 FOMC Minutes – MSTR, COIN and CRCL
The Federal Reserve will release minutes for the April 28 FOMC meeting on May 20.…
- Price Analysis
Why is Bitcoin Price Down Today? (16 May)
Bitcoin price hovered below $78,000 on May 16 as crypto markets faced renewed selling pressure…
- Price Analysis
Crypto Weekly Recap: CLARITY Advances, US Inflation Soars, Wall Street Raises COIN Stock Target, Strategy Resumes Bitcoin Buys
The crypto market had a volatile week because the total market cap opened the week…
- Price Analysis
What’s Next for Dogecoin Price, Recovery or Another Drop?
Dogecoin price traded near $0.112 on Thursday after gaining more than 20% during the past…
- Price Analysis
Pi Network Price Prediction After Creator-Focused App Studio Upgrade
Pi network price remained under pressure on Friday as the broader cryptocurrency market continued consolidating…
- Price Analysis
Why Bitcoin Price Could Reach $88,000 Despite Rising Odds Of Fed Rate Hikes
Bitcoin (BTC) price might reach $88,000 because it is currently 11.2% lower than the ETF…