LUNC Price Breakout Sparks 30% Upside Rally, Is $0.00015 Next Target?
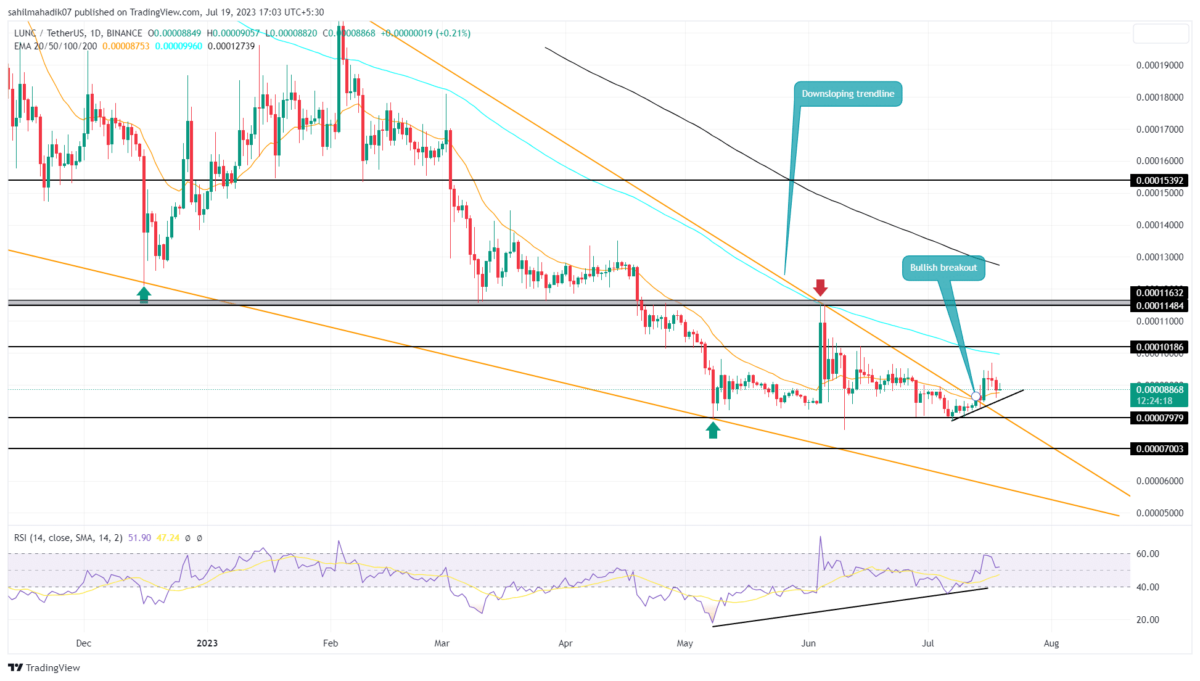
With the recent upswing in the crypto market, the LUNC price gave a bullish breakout from the long-coming resistance trendline of the wedge pattern. After seven months of a steady downtrend, this breakout was an early sign of trend reversal. However, the breakout rally topped at the $0.0000968 mark and reverted to retest the breached resistance as potential support. Can this pullback bolster buyers to surpass the $0.0001 psychological mark?
Also Read: Terra Luna Classic L1TF On Guardarian Deal and Q3 Roadmap, LUNC Up 20% & USTC 50%
LUNC Price Daily Chart
- A new support trendline carries the short-term recovery in the LUNC price
- The 20-day EMA slope offers additional support to crypto buyers
- The intraday trading volume in the LUNC coin is $35.2 Million, indicating a 34% loss.
The falling LUNC price is currently in a post-breakout retest phase which is meant to check price sustainability at higher levels. With an intraday loss of 0.11%, this altcoin may soon hit the new support trendline carrying a fresh recovery rally.
This dynamic support could offer buyers a suitable footing to sustain bullish momentum and continue the upward march. If the buying pressure persists, the LUNC price could rise 30% and poke an early target of $0.00015.
However, in theory, the falling wedge setup possesses a few predetermined swing highs formed during the pattern formation. Thus, a prolonged uptrend could reach the potential target of $0.000212, followed by $0.00028.
Will LUNC Price Plummet to $0.00008?
If the market sentiment continues to waver in uncertainty, the LUNC sellers may break the support trendline of the new recovery rally. This breakdown would start reflecting weakness in bullish momentum and may offset the bullish thesis if the coin price plunged below $0.00008.
Recent Posts
- Price Analysis
Cardano Price Nears Death Cross Despite Whale Holdings at 9-Year High – Bearish Ahead?
Cardano (ADA) price is down 3.67% today, May 28, to trade at $0.23 at the…
- Price Analysis
How Low Can Ethereum Price Go?
Ethereum price fell below $2,000 on May 28, marking its first break under that level…
- Price Analysis
3 Reasons XLM Price is Up 14% Today, May 28, as Stellar Enters Wall Street
Stellar (XLM) price is up 14% today, May 28, to trade at $0.169 at the…
- Price Analysis
Pepe Coin Price Prediction as Bitcoin Crashes Below $75k
Pepe Coin Price held firm on Wednesday, as Bitcoin slipped below the $75,000 mark. PEPE…
- Price Analysis
Will XRP Price Rally Above $1.40 as XRPL Version 3.1.3 Goes Live?
XRP price remained under pressure on Wednesday, slipping 0.9% to trade near $1.33. However, the…
- Price Analysis
3 Reasons Pi Network Price Is Crashing Despite Ongoing Protocol Upgrades
Pi Network price has dropped by 19% since April 27, and it trades at $0.143…