PEPE Price Prediction: Will Buyers Defend $0.00000075 Support in Current Market FUD?
Over the past week, Pepe Coin price action has been marked by indecision. Its largely sideways movement, punctuated by short-bodied candles and pronounced wick rejections at both ends, underscores a market waiting for cues. This drawn-out consolidation phase, as highlighted in our previous article, has given rise to a bearish pennant pattern. Typically, this formation suggests a potential continuation of the preceding downtrend.
Also Read: PEPE Price Prediction: Bearish Flag in $PEPE Chart Signal a 10% Downturn
Breakdown from Support Trendline Sets Pepe Price for 11% Drop
- The Pepe price may consolidate longer before a decisive breakdown.
- The coin price trading below the 4-hour chart EMAs(20, 50, 100, and 200) indicates a downtrend is active.
- The 24-hour trading volume in the Pepe coin is $34 Million, indicating an 18% loss.
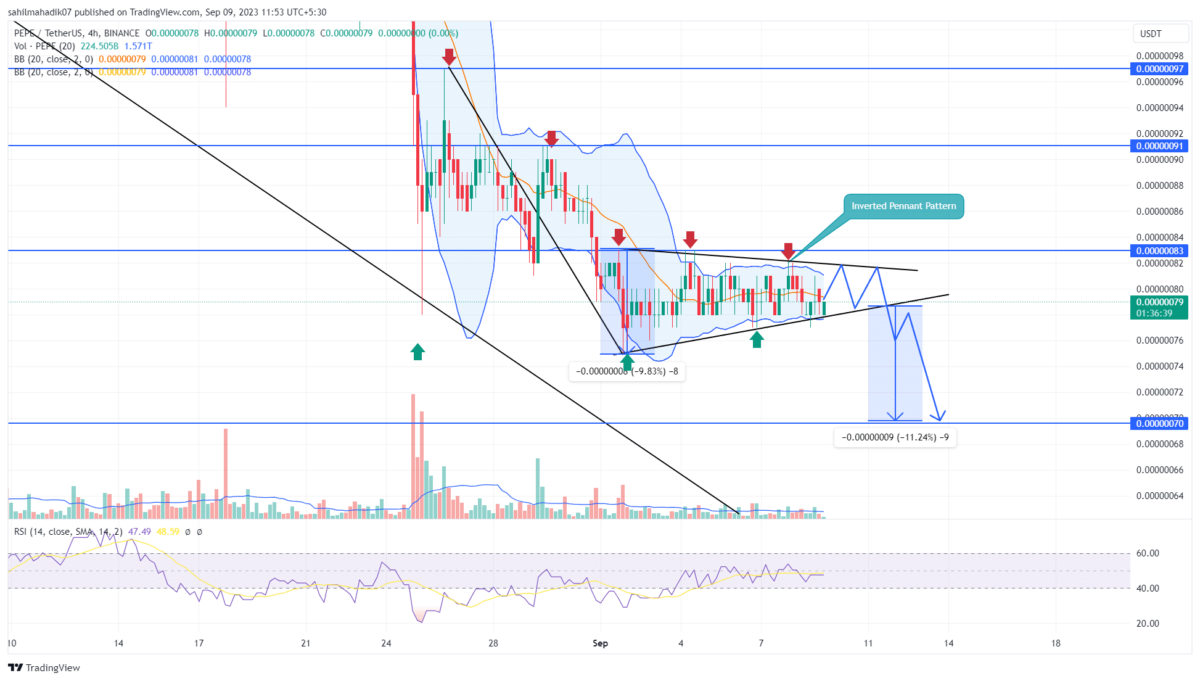
At the time of writing, Pepe Coin is priced at $0.000000788. Today’s movement sees it recording a modest 1.25% downtick, bouncing back to the pennant’s lower boundary. This downtick might indicate a persistence of the current consolidation, at least for a few more trading sessions.
Yet, with the price steadily approaching the apex of the pennant, a decisive breakout – or breakdown – is looming on the horizon. Many analysts may towards a bearish outcome for PepeCoin, given the pattern’s traditional implications.
Should the price breach the pennant’s lower trendline, it would signify a resurgence of bearish sentiment. In such a scenario, we might see Pepe Coin slide by approximately 11%, breaking below the $0.00000075 support to hit $0.00000070.
Can Pepe Price Rise Back to $0.00000091?
While a bearish outcome seems more probable, it’s not set in stone. For those seeking a safer entry point, it might be prudent to await a confirmed breakout from the pennant. The space between the pattern’s converging trendlines represents a ‘no trading zone’ for many. A decisive break above the pennant could negate the bearish outlook, propelling Pepe Coin towards the $0.00000091 mark.
- Relative Strength Index: Despite a rising RSI, the price action making a lower high indicates the buyers’ attempts to recover are getting undermined.
- Bollinger Band: The sideways track of Bollinger Band indicators reflects an increasing market volatility.
Recent Posts
- Price Analysis
Is It A Good Time to Buy Pi Network Coin Ahead of Major Upgrade And Surge In Users
Pi Network price had outperformed most tokens at press time with a 6% intraday gain…
- Price Analysis
COIN, MSTR, CRCL Stock Prices As S&P 500 Hits Record High Amid Push For Fresh Iran Peace Talks
Crypto stocks, including Coinbase (COIN), Strategy (MSTR), and Circle (CRCL), have posted massive gains this…
- Price Analysis
Meme Coins Price Prediction: DOGE, SHIB, PEPE, and PENGU as Bitcoin Rallies Above $75k
The meme coin price has seen a surge on Thursday after the crypto market surge…
- Price Analysis
Dogecoin Price Outlook After X Rolls Out Smart Cashtags for Crypto and Stocks
Dogecoin price holds above $0.094 after X rolls out smart cashtags for crypto and stocks,…
- Price Analysis
Top 3 Bullish Signals for Pi Coin Price by April-End 2026
Pi Coin appears to be defying the downtrend in the broader crypto market after jumping…
- Price Analysis
Bitcoin, XRP, and Ethereum Price Forecast as CLARITY Act Misses April Timeline
The US Senate has failed to schedule the CLARITY Act, in a move that has…