Pepecoin Price Analysis: How Far Will the Retracement Take $PEPE Price?
Pepepcoin Price Analysis: While the market leaders, Bitcoin and Ethereum price showed a halt in their recovery rally, the Frog-themed Memecoin Pepe entered a minor correction phase after hitting the $0.0000019 barrier. This retracement seems reasonable as the buyers would need a break after significant growth in the latter part of June. However, will PEPE price continue to uptrend after this correction?
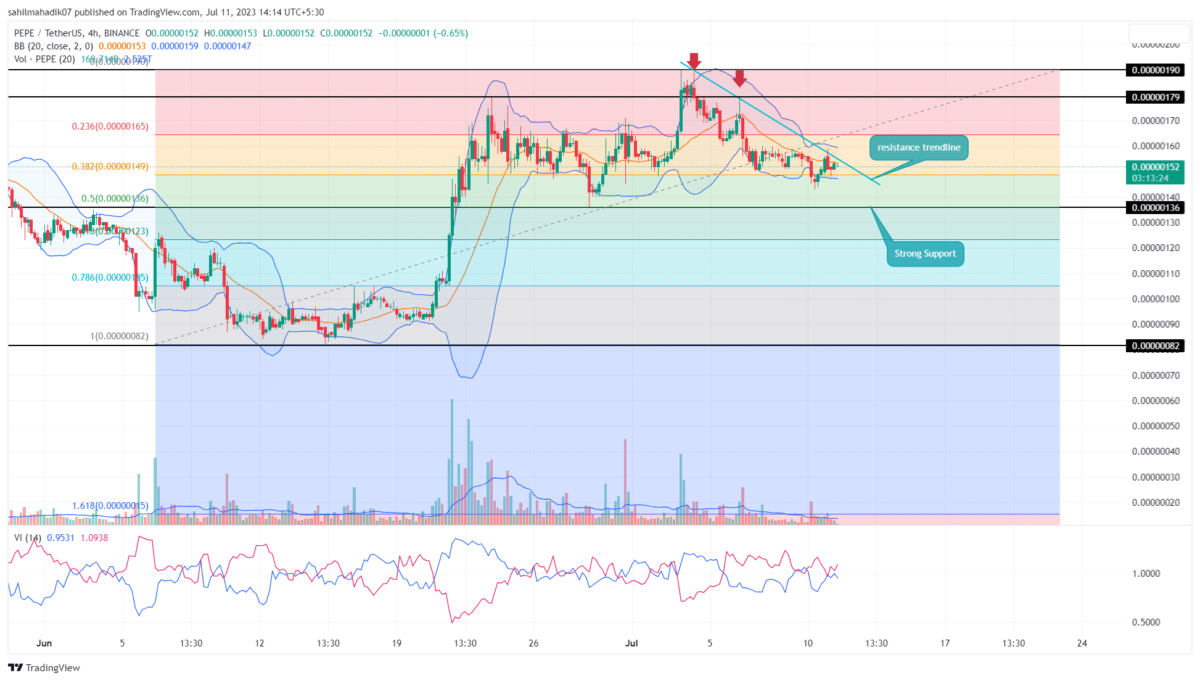
Pepecoin Price Daily Chart
- The $0.00000136 support stands as a crucial support of the PEPE price.
- A breakout above the overhead trendline will reignite the bullish momentum.
- The 24-hour trading volume in the Pepecoin coin is $114.5 Million, indicating a 56 % gain.
Over the week, the PEPE price has tumbled around 24.6% from $0.0000019 and reached today’s low of $0.00000143. This correction phase is currently carried by a downsloping trendline acting as a dynamic resistance to pressurize buyers.
By press time, this memecoin trades at $0.0000015 and shows long-tail rejection at 38.2% Fibonacci retracement level. Thus, demand pressure could trigger another bounce to the overhead trendline and replenish the selling momentum.
With sustained buying, the PEPE price could tumble another 8% and retest the strong demand zone of $0.00000136 in confluence with 50% FIB. This level is crucial for buyers as losing the last swing low would indicate notable weakness in bullish momentum.
Will Pepecoin Coin Strike the 0.0000019 Barrier?
The falling Pepecoin price backed by reducing volume indicates the current correction is temporary. Therefore, interested traders looking for a long entry opportunity must wait for a breakout above the overhead trendline. This breakout will signal the resumption of a bullish recovery and the possibility to surpass the $0.0000019 mark.
- Bollinger Band: The lower band of the Bollinger Band indicator at $0.0000019 increases the support power of this level.
- Vortex indicator: A bearish crossover between the VI+(Blue) and VI-(orange) reflects the increasing selling momentum in price.
Recent Posts
- Price Analysis
Here’s Why Pi Network Price Is Outperforming Bitcoin Right Now
Pi Network price is gaining momentum as April draws to a close, outperforming Bitcoin in…
- Price Analysis
Can Ethereum Price Repeat Its 2025 Rally as Active Addresses, Holders Reach Record Highs?
Ethereum (ETH) is down today, April 28, and stood at $2,282 at press time with…
- Price Analysis
XRP Price Outlook as U.S. Eyes Potential Strategic Reserve Plan
XRP Price moved below the $1.40 level during the past 24 hours as the U.S.…
- Price Analysis
Cardano Price Prediction as Charles Hoskinson Outlines ADA’s Quantum Timeline
Cardano (ADA) has never recovered since falling off the list of the top ten largest…
- Price Analysis
XRP Price Forms Descending Triangle — Can $1.40 Hold After Bearish MACD Shift?
XRP price hovered at $1.40 on after a slight market cool off over the past…
- Price Analysis
Why Bitcoin Price Could Reach $90K in Q2 as Galaxy CEO Predicts CLARITY Act Approval in June
Bitcoin (BTC) is at a crossroads. Bulls are having a hard time pushing past $80K,…