SHIB Price Prediction: Will Shiba Inu Coin Regain $0.00001 Mark in September?
With the leading cryptocurrency Bitcoin gaining strong support at $25000 the prominent altcoins have started witnessing demand pressure. As a result, the aggressive downfall in the Dog-themed memecoin reverted to the $0.0000074 level to trigger a minor pullback. However, with the overall negative market trend intact, will the SHIB price hold $0.000007?
Also Read: Shibarium Rug Pull Shakes SHIB and Binance Smart Chain
Bullish Reversal Opportunity at $0.000007
- The SHIB price below daily EMAS(20, 50, 100, and 200) accentuates the overall downtrend.
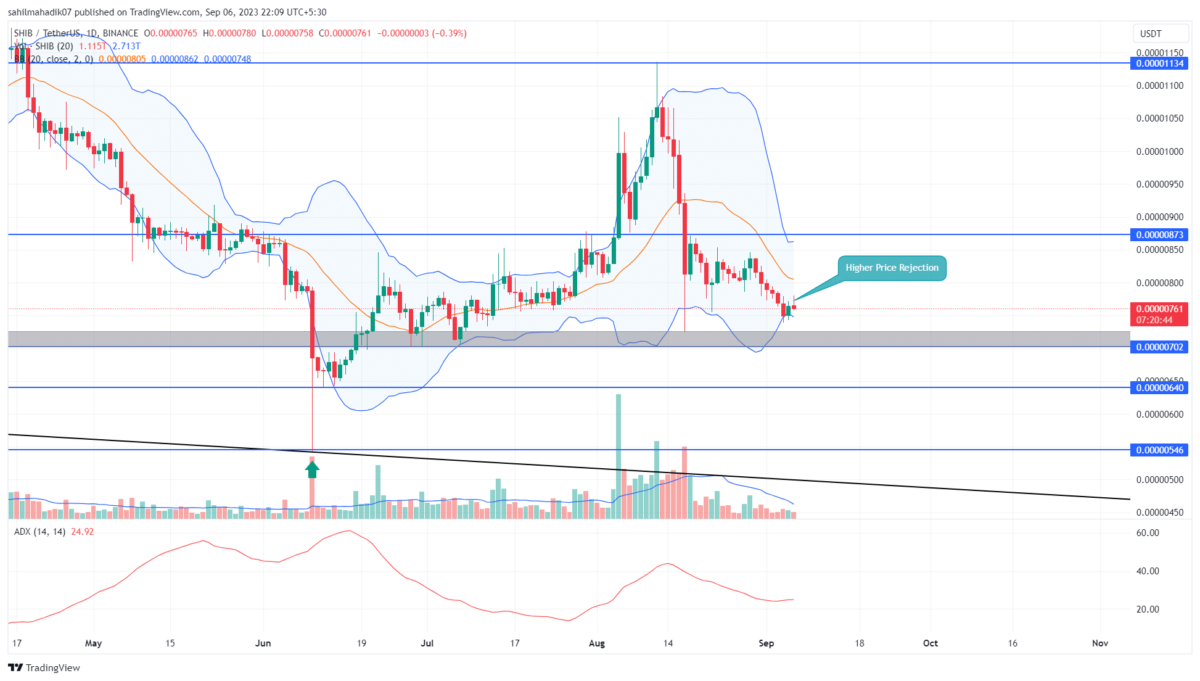
- A technical chart reflects a reversal opportunity at $0.000007
- The intraday trading volume of the Shiba Inu coin is $94 Million, showing a 5.7% gain.
Within a month, the Shiba Inu price has witnessed an aggressive sell-off. From the last swing high of $0.00001136, the memecoin lost a market value of 35.6% to reach a low of $0.0000075.
Currently, the price action is witnessing a minor pullback in its downtrend as the broader market witnesses demand pressure. The uptick could recuperate the exhausted selling pressure and resume the downward trendline.
By the press time, the SHIB price traded at $0.000000765 with an intraday gain of 0.13%. However, a long-upper wick rejection candle indicates the overhead supply pressure. With sustained selling, the coin price is poised to hit the demand zone at $0.00000725-$0.000007.
However, this falling price is associated with decreasing volume indicating weakness in bearish momentum. Therefore, the coin traders may witness demand pressure at the $0.000007 mark for a potential rebound.
Should You Buy SHIB Price at $0.000007?
The Shiba Inu’s price currently hovers near a crucial support level at $0.000007. While this level is expected to offer significant buying pressure, the technical chart portrays a broader bearish outlook, marked by a descending wedge pattern. This pattern is characterized by the coin’s price fluctuating between two narrowing trendlines. Even if the Shiba Inu enthusiasts drive a recovery from this support, a genuine bullish turnaround would necessitate a break above the upper trendline. This Breakout would propel this memecoin above the $0.00001 mark.
- Bollinger Band: The narrow range of Bollinger band indicator reflects indecisiveness among traders.
- Average Directional Index: A slight upswing in the ADX Slope reflects the sellers’ strengthening their grip over the coin.
Recent Posts
- Price Analysis
Why is Bitcoin Price Down Today? (16 May)
Bitcoin price hovered below $78,000 on May 16 as crypto markets faced renewed selling pressure…
- Price Analysis
Crypto Weekly Recap: CLARITY Advances, US Inflation Soars, Wall Street Raises COIN Stock Target, Strategy Resumes Bitcoin Buys
The crypto market had a volatile week because the total market cap opened the week…
- Price Analysis
What’s Next for Dogecoin Price, Recovery or Another Drop?
Dogecoin price traded near $0.112 on Thursday after gaining more than 20% during the past…
- Price Analysis
Pi Network Price Prediction After Creator-Focused App Studio Upgrade
Pi network price remained under pressure on Friday as the broader cryptocurrency market continued consolidating…
- Price Analysis
Why Bitcoin Price Could Reach $88,000 Despite Rising Odds Of Fed Rate Hikes
Bitcoin (BTC) price might reach $88,000 because it is currently 11.2% lower than the ETF…
- Price Analysis
Crypto Price Today: BTC Holds $80K, ETH at $2,250, XRP Hits $1.45 as HYPE Soars 20% on CLARITY Act Progress
The crypto price today traded higher as investors responded positively to fresh regulatory developments in…