Solana Price Analysis: Bullish Pennant Pattern Signals a Surge Beyond $30
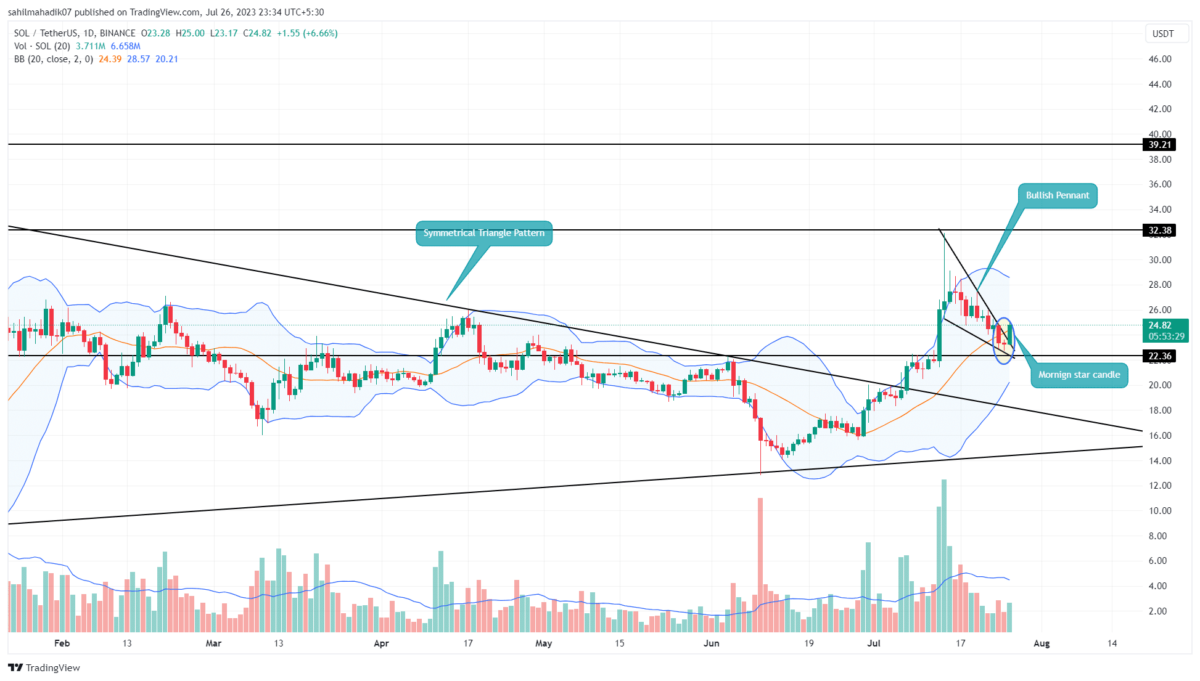
In response to the current correction phase in the crypto market, the Solana price witnessed a price drop from a $32.16 high to a $22.73 low. This two weeks’ downfall registered a 30% loss offering a pullback opportunity to the traders who missed the initial rally. Moreover, the daily time frame chart shows a bullish reversal morning star candle pattern, indicating the first sign of an uptrend continuation.
Also Read: What’s Next for Solana Price After a 120% Surge?
Solana Price Daily Chart
- A retracement to the 50% level reflects the overall bullish trend is intact
- A bullish breakout overhead resistance will offer buyers significant support to carry a recovery above $30
- The 24-hour trading volume on the Solana coin is $503.2 Million, indicating a 39% gain.
A closer look at the lower time frame shows the recent correction shaped into a pennant pattern. This chart pattern is often spotted in an established bull run offering a short break period before the continuation of the prevailing trend.
Within the intraday gain of 6.5%, the Solana price shows a bounce back from the combined support of $22.75 and 50% in the Fibonacci retracement level.
This upswing also provides a breakout from the resistance trendline of the pennant pattern. By press time, the Solana price trades at the $24.8 mark, and should obtain significant support from the breached trendline
With sustained buying the SOL price could rise 28% to challenge the $32.16 mark for a bullish breakout.
Can Solana Price Recovery Reach $50?
The recent upswing in the Solana price is also fuelled by the completion of a symmetrical triangle pattern. These chart patterns often come with predetermined targets, giving a potential level where the current price rally may mature. Therefore, under the influence of the triangle pattern, the Solana price is set for a recovery to $60.
- Super Trend: The green film projected in the daily chart accentuate the bullish trend persists.
- Direction Moving Index: The DI+(blue) and DI-(orange) expanding again in a bullish crossover state indicates the buying momentum in returning to the market.
Recent Posts
- Price Analysis
Top 3 Crypto Coins Near Their Lowest Levels This Month: BTC, ETH, and ADA
The crypto market fell 5.61% to $2.1 trillion as rate concerns pressured risk assets. Bitcoin…
- Price Analysis
Cardano Price Flashes Bottom Signal as 2022 Pattern Repeats Ahead of Crucial June 9 Governance Vote
Cardano (ADA) price has dropped below $0.16 for the first time since December 2020, and…
- Price Analysis
3 Ways to Think About SpaceX Before Its IPO
SpaceX submitted a confidential filing for an IPO on April 1, 2026, before making this…
- Price Analysis
PI Coin Price Could Be Very Different After June 8
Pi Coin price extended losses on Thursday as fresh unlock pressure weakened market confidence before…
- Price Analysis
MSTR Stock Crash Deepens as Strategy Hits Historic $10.8B Unrealized Loss
Strategy (NASDAQ: MSTR) has dropped by 26% since June 1, when it announced that it…
- Price Analysis
1 Reason XRP Price Could Surge in August
XRP price could see a surge in the upcoming month as traders watch fresh developments…