Solana Price Analysis: $SOL Price Out from Long Correction Gaze on $26 Target; Buy Now?
Solana Price Analysis:: Amid the recent correction in the crypto market, the falling Solana price resonated between the two converging trendlines of the falling wedge pattern. In its core concept, this chart setup signals a gradual decrease in bearish momentum, which eventually offers trend control in buyers’ hands. A bullish breakout from this pattern signals the end of the prevailing correction phase or the start of a new recovery rally.
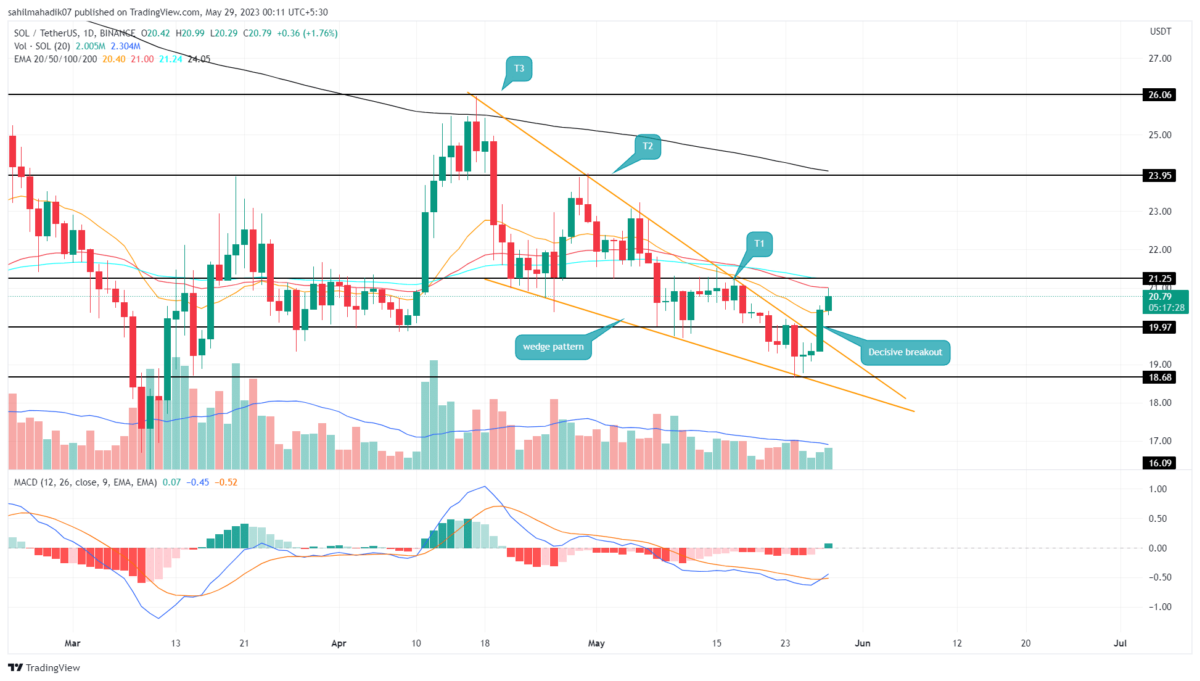
Solana Price Daily Chart
- A bullish breakout from the long-coming resistance trendline signals a shift in market sentiment from selling on rallies to buying on dips
- A potential rally in Solana price may face overhead supply at $21.7 and $24.
- The 24-hour trading volume in the Solana coin is $277.5 Million, indicating a 148% gain.
On May 25th, the Solana price gave a massive breakout from the resistance trendline of the wedge pattern. After facing multiple rejections from this dynamic resistance in the last five weeks, this breakout signifies the weapon of sellers has been breached the buyers can wrestle to take trend control.
As of now, the Solana price trades at $20.67 with an intraday gain of $1.17. This follow-up green candle indicates the bullish momentum is aggressive and thus adds more conviction to coin holders.
However, the coin price witnessed a minor pullback to retest the breached trendline as potential support. If the buyers manage to sustain above the reclaimed trendline, the potential rally could reach the $26 mark, a projection of a 26% growth potential.
Will Solana Price Reach $26?
The completion of the wedge pattern has set the Solana price for a massive recovery. However, in the core concept, each swing high during the pattern formation is a valid target for buyers after the breakout. Thus, the SOL price may witness in between hurdles like $21.25 and $24 before hitting the $26 high
Moving Average Convergence Divergence: A bullish crossover between the MACD(blue) and the signal(orange) projects a sign of trend reversal.
Exponential Moving Average: The 50-and-100-day EMA moving near the $21.17 mark creates a high supply zone against buyers.
Recent Posts
- Price Analysis
Top 3 Reasons Cardano Price Could Reclaim $0.30 as CME Futures Volumes Surge
Cardano (ADA) is mimicking the ongoing steady recovery in the broader market and had surged…
- Price Analysis
Why MSTR Stock Price Could Hit $200 by May as Strategy’s BTC Gain Jumps 82% in One Week
Strategy (NASDAQ: MSTR) has been on a bullish trajectory for the last few weeks, and…
- Price Analysis
Why XRP Price is Outperforming Bitcoin and Ethereum This Week?
Over the past week XRP has outpaced Bitcoin and Ethereum during a volatile trading period.…
- Price Analysis
Major Cryptocurrency Market Events to Watch Before April Closes
As the month of April nears its end, the cryptocurrency market has advanced 1.48% over…
- Price Analysis
What to Expect in BTC, ETH, XRP Price This Week Ahead of 2 Key Economic Events
Bitcoin (BTC), Ethereum (ETH), and XRP traded lower on Monday during the Asian trading session…
- Price Analysis
Pi Network Price Prediction Ahead of April 27 Protocol 22 Upgrade Deadline
Pi Network (PI) price remained near $0.171 on Monday as investors evaluated geopolitical tensions and…