Weekly Analysis Hints Bitcoin Price Could Reach $25000 In Near Future
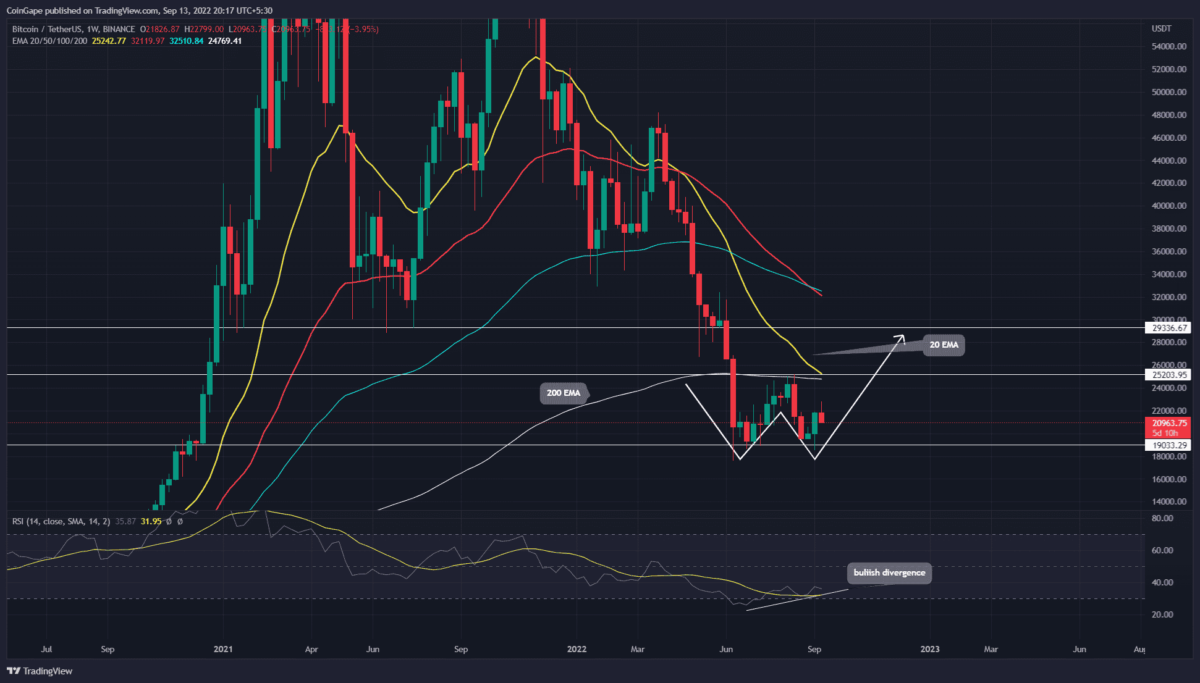
The Bitcoin technical chart shows the formation of a double bottom pattern in the weekly time frame chart. The base support for this pattern is at $19000 as the price has rebounded twice from this level in the past three months. However, can the current sell-off offset the near-term future goals of Bitcoin holders?
Key points
- The BTC price check buyer’s commitment at $20600 support
- The Weekly chart shows a bearish crossover of 50 and 100 EMAs
- The intraday trading volume in Bitcoin is $34.6 Billion, indicating a 10.5% loss
The double bottom pattern is often found in the market bottom and initiates a significant recovery if executed properly. Furthermore, the Bitcoin price currently trades at the $21028 mark, but under the influence of this pattern, it should rally to the neckline resistance of $25000.
A bullish breakout from this neckline resistance is crucial for coin holders as it will signal an early sign of trend reversal. The interest traders entering this trade could capture a rally to the $29300-$30000 mark.
Technical indicator in Weekly chart
EMAs: the 20 and 200 EMA wavering at the $25000 neckline make it a high area interest(AOI). These crucial technical levels accumulated at the same level suggest the price action at this mark will significantly influence Bitcoin’s future prices.
RSI: a bullish divergence in the RSI slope bolsters the completion of the double bottom pattern.
Can $20800 Support Prevent Further Downfall?
Today, Bitcoin faces sudden selling pressure as the fresh released consumer price Index(CPI) signals an 8.3% YoY inflation. Moreover, after this unfavorable CPI data, the interest rate hike of 1% seems likely.
As a result, the Bitcoin price is 6.6% down today and currently trades at the $20903 mark. However, the volume activity is low in comparison to the last six days of recovery of the Bitcoin price. Moreover, the coin price hit the combined support of $20800-$20600 and 20-day EMA, which should assist the buyers in fighting back.
Thus, if the Bitcoin price sustains above this support, the above bullish theory should do its work.
However, today’s candle closing is important, and a breakdown below the $20600 mark will pull the prices back to the $18830 mark.
- Resistance level- $22550 and $25000
- Support level- $20800 and $18830
Recent Posts
- Price Analysis
Dogecoin Price Outlook as Falling Wedge Signals Possible Breakout
Dogecoin price held above the $0.10 support level on Tuesday as market conditions weakened. DOGE…
- Price Analysis
Is Bitcoin Price at Risk of Crashing After Fresh US Strikes on Iran?
Bitcoin price stayed near $77,000 on Tuesday as traders watched fresh tension between the United…
- Price Analysis
HOOD Stock Forecast as Regulators Approve Robinhood’s $180M Crypto Acquisition Deal
Robinhood is about to dip its toes further into the crypto industry after regulators in…
- Price Analysis
Crypto Market Today: BTC Hovers Below $77K, ETH Holds $2K Support, XRP and HYPE Slip as NEAR Surges 10%
The crypto market today slipped as traders reacted to renewed geopolitical stress, weaker risk appetite,…
- Price Analysis
Will Cardano Price Crash to $0.20 Amid ADA Governance Crisis?
Cardano (ADA) has dropped by 0.9% to trade at $0.241 at the time of writing.…
- Price Analysis
Why is Dogecoin Price Not Rising?
Dogecoin (DOGE) has gone down by 3.29% in just seven days to trade at $0.102…