What’s Ahead for $PEPE Price After 25% Jump in a Week
Over the past fortnight, the pepe coin has largely traded in a sideways manner, oscillating between the $0.06 and $0.07 levels. However, with a positive sentiment shift in the broader crypto market, the coin buyers gave a decisive breakout from the upper boundary on September 27th. Anyhow, can this breakout catalyze a sustained rally for this meme coin?
Also Read: Memecoin Price Analysis: DOGE, PEPE, SHIB, BONE; Winners And Losers
Is the Current Recovery Sustainable?
- The crypto traders may face high selling pressure at $0.0000083
- A potential breakout from the resistance trendline will signal an early sign of trend reversal
- The 24-hour trading volume in the Pepe coin is $111.5 Million, indicating a 27% loss.
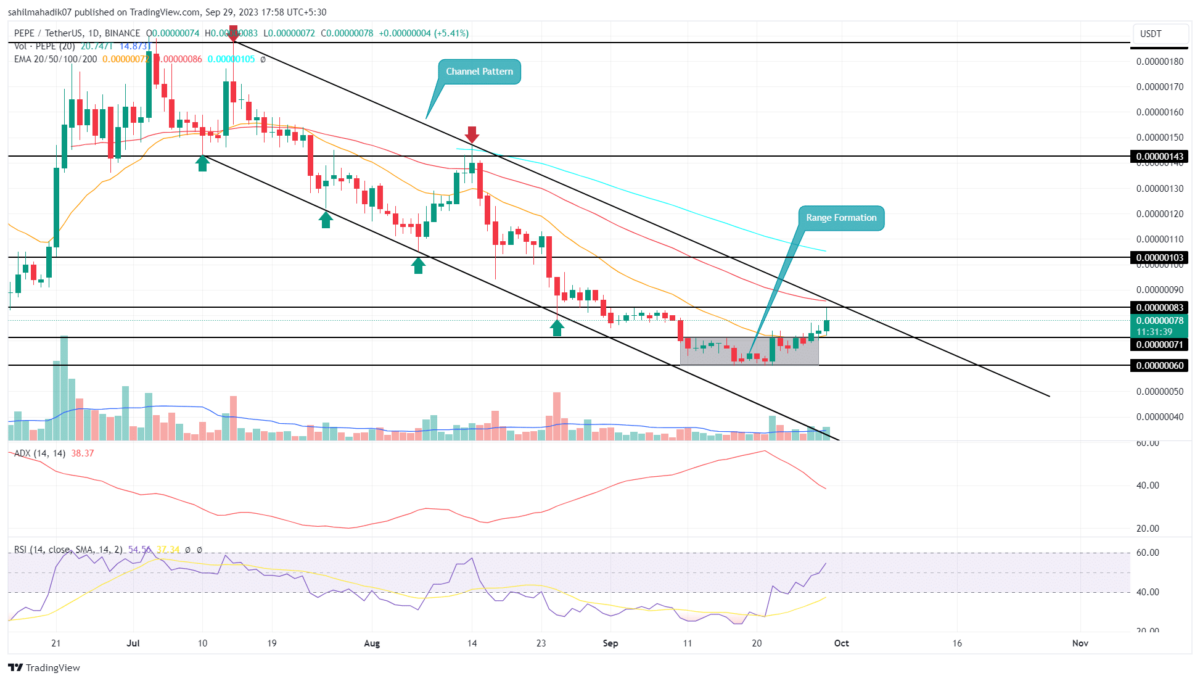
On September 22, the Pepe coin price saw a significant reversal from the psychological support level of $0.0000006. This price surge corresponds with a generally positive sentiment in the broader crypto market, marking a 35% gain within just one week.
At the time of writing, the coin is trading at $0.0000008, approaching a major resistance zone at $0.00000085. This resistance is further amplified by a downward-sloping trendline, which forms the upper boundary of a channel pattern.
The last two months’ correction can be marked by this channel pattern, where its upper trendline has acted as a dynamic resistance. A high wick rejection observed in today’s candle reflects the overhead supply pressure in action.
If an attempt to breach this trendline results in increased selling pressure, we could see Pepe coin entering a new correction, potentially revisiting its previous support level at $0.0000006 and may break beyond.
Will PEPE Price Break $0.000001?
If the overall market sentiment remains bullish, the Pepe coin could aim for a decisive breakout above the declining resistance trendline. A daily candlestick closure above this level would offer robust support for the coin price, possibly extending its recent rally. In such a bullish scenario, the coin price could soar by approximately 70%, targeting the $0.00000143 level.
- Exponential Moving Average: The 50-day EMA walking along the upper trendline may exert additional selling pressure on traders.
- Relative Strength Index: The daily RSI slope above 50% reflects a positive sentiment in the market.
- Average Directional Index: The falling ADX slope reflects the weakening bearish momentum.
Recent Posts
- Price Analysis
Why MSTR Stock Price Could Hit $200 by May as Strategy’s BTC Gain Jumps 82% in One Week
Strategy (NASDAQ: MSTR) has been on a bullish trajectory for the last few weeks, and…
- Price Analysis
Why XRP Price is Outperforming Bitcoin and Ethereum This Week?
XRP price surged to $1.44 on Tuesday after outperforming Bitcoin and Ethereum during a volatile…
- Price Analysis
Major Cryptocurrency Market Events to Watch Before April Closes
As the month of April nears its end, the cryptocurrency market has advanced 1.48% over…
- Price Analysis
What to Expect in BTC, ETH, XRP Price This Week Ahead of 2 Key Economic Events
Bitcoin (BTC), Ethereum (ETH), and XRP traded lower on Monday during the Asian trading session…
- Price Analysis
Pi Network Price Prediction Ahead of April 27 Protocol 22 Upgrade Deadline
Pi Network (PI) price remained near $0.171 on Monday as investors evaluated geopolitical tensions and…
- Price Analysis
Ethereum and XRP Price Outlook After Iran Peace Talks Stalled and Closure of Strait of Hormuz
Ethereum and XRP prices advanced on Monday as traders positioned for potential gains later this…