What’s Ahead for XRP Price After a Break Below $0.5?
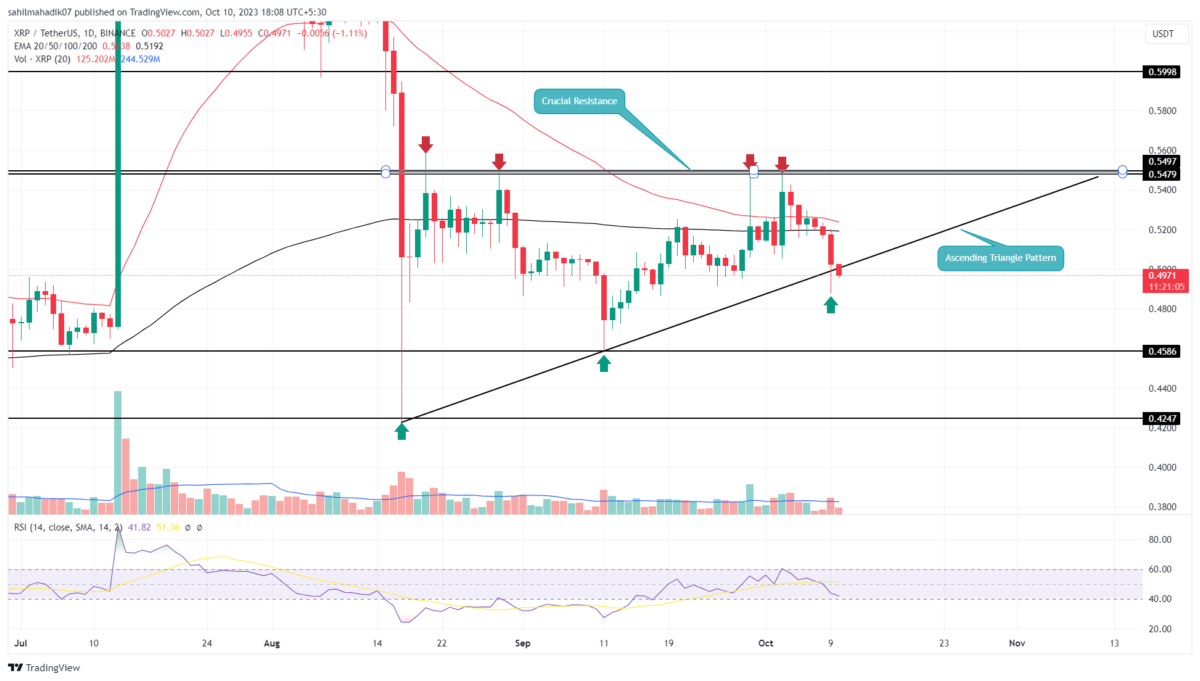
In the midst of a faltering altcoin market, the XRP price encountered a pronounced pullback after facing resistance at the $0.55 mark on October 3rd. Over the past week, this downward shift resulted in a 9.5% dip, dragging the cryptocurrency’s value down to $0.49. Alarmingly, this descent has led sellers to breach the supportive boundary of an ascending triangle pattern on its chart, hinting at a potentially deeper correction ahead.
Also Read: Ripple Bids Farewell to CFO, Is Leaders Exodus Returning?
Will the XRP Price Fall to $0.42?
- A breakdown from an ascending triangle pattern hints at accelerated selling pressure.
- The falling XRP price may witness significant support around $0.458 and $0.42.
- The intraday trading volume in the XRP is $752.2 Million, indicating a 1.62% loss.
Amidst the last 50 days of consolidation, the XRP price shows the formation of an ascending triangle pattern in the daily time frame chart. Typically, this pattern is projected as a bullish pattern, which promotes a significant rally after the breakout of its neckline.
Within the last two months, the coin price has faced four reversals from the $0.55 neckline, indicating it has a stronger resistance zone. With the last reversals from this resistance on October 3rd and weakness across the broader market, the XRP price has broken below this pattern’s ascending support trendline.
If the daily candle manages to close below the breached support, the sellers would gain an extra edge to pressurize coins to lower prices. The post-breakdown fall would plunge the price 7.5% down to hit the nearest support at $0.458, followed by the $0.42 mark.
[converter id=”xrp-xrp” url=”https://coingape.com/price/converter/xrp-to-usd/?amount=1″]
Should You Go Bearish on XRP Coin?
On October 9th, the XRP Price showed a failed attempt to breach the lower support trendline of the ascending triangle pattern. Despite the back of a huge volume, the coin price could not sustain below the trendline which resulted in a long tail rejection candle. This daily candle reflects the sellers would need even higher momentum to break past this support. Thus, it is crucial for players to wait for a candle to close to confirm a bearish breakdown. If by the day’s end, the XRP Price surges back above the lower trendline, the coin price would likely continue the consolidation trend within the triangle pattern.
Recent Posts
- Price Analysis
XRP Price Set for New Volatility Cycle as CME Opens 24/7 Crypto Trade
XRP price hovered at $1.30 after gaining 1.66% over the past 24 hours. The move…
- Price Analysis
Is AI Draining Bitcoin Liquidity as IBIT Outflows Extend While Wall Street Flocks to Anthropic?
Bitcoin (BTC) price is down by 5.42% in seven days to trade at $73,693 today,…
- Price Analysis
Is Bitcoin Price Reacting More to War Risk Than Crypto News?
Bitcoin price returned to the macro spotlight on Friday as US-Iran tensions influenced crypto market…
- Price Analysis
Cardano Price Nears Death Cross Despite Whale Holdings at 9-Year High – Bearish Ahead?
Cardano (ADA) price is down 3.67% today, May 28, to trade at $0.23 at the…
- Price Analysis
How Low Can Ethereum Price Go?
Ethereum price fell below $2,000 on May 28, marking its first break under that level…
- Price Analysis
3 Reasons XLM Price is Up 14% Today, May 28, as Stellar Enters Wall Street
Stellar (XLM) price is up 14% today, May 28, to trade at $0.169 at the…