What’s Next for LUNC Price Amid Current Uncertainty; $0.0001 or $0.000082?
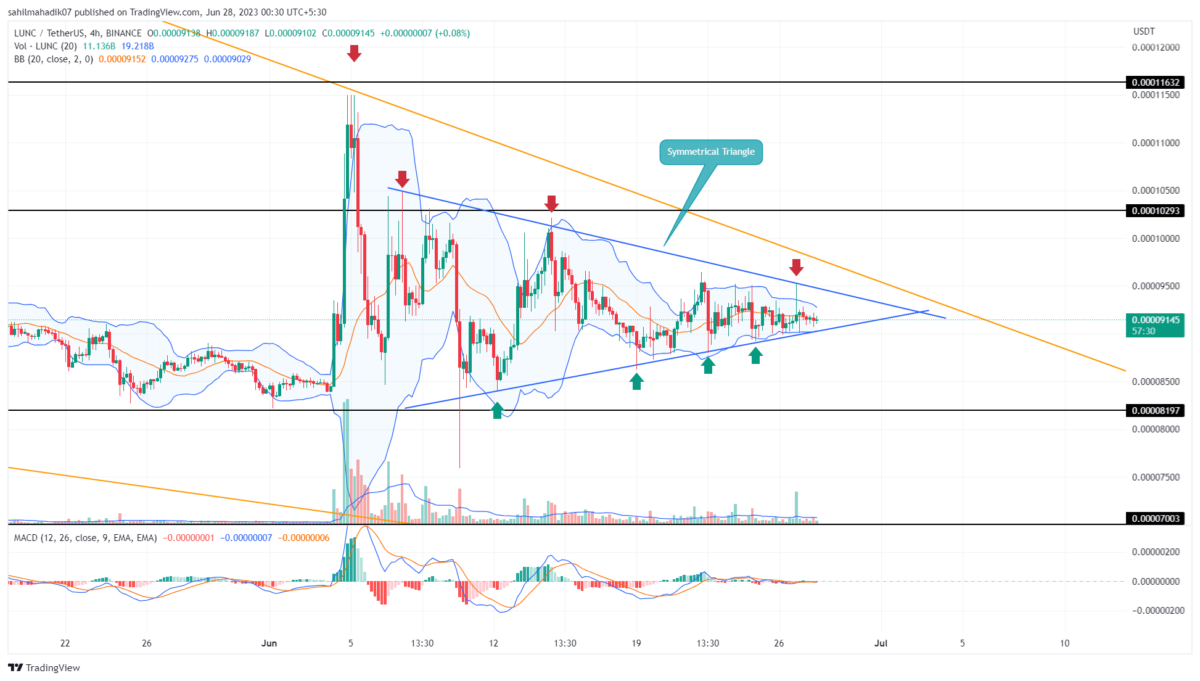
Decoupling from the later June recovery in the crypto market, the LUNC price has been in a sideways trend for over three weeks. The daily candle showcasing short bodies with longer wicks on either side indicates uncertainty among market participants. However, a closer look at the lower time frame chart project, despite the market indecisiveness, the LUNC price strictly follows the formation of a symmetrical triangle pattern. Here’s how this pattern could assist traders to determine the near future trend.
Also read: Terra Luna Classic To Burn 900 Mln LUNC Reminted From Binance, Total Burn 65 Bln
LUNC Price Daily Chart:
- The area encompassed by the triangle pattern can be considered a “no-trading zone.”
- The triangle pattern breakout would intensify the underlying bullish momentum
- The intraday trading volume of the LUNC coin is $32.5 million, indicating a 40.2% loss
For the past three weeks, the LUNC price has been resonating between the converging trendline of the triangle pattern. In theory, this pattern is a continuation pattern that triggers a brief period of consolidation before continuing with the prior trendline.
Currently, the LUNC price trades at $0.0000916 and gradually gets close to the triangle pattern’s peak. The narrow range available will soon lead to a breakout that could offer a trading opportunity to interested market participants.
A possible breakdown below the pattern’s support trendline will accelerate the selling pressure and plunge the altcoin 10% to hit the next significant support of $0.0000822.
Will LUNC Price Recovery to the $0.0001 Mark?
Two significant resistance are currently standing in the way of LUNC’s price to obtain a sustained recovery. These resistances are the triangles pattern upper trendline and a long-coming downsloping trendline. The buyers need to breach these resistances to gain suitable support for the future. The potential breakout will surge the coin price to $0.00000103 and $0.00000116.
- Moving Average Convergence/Divergence: A flattish slope of the signal(orange) and MACD(blue) line project uncertainty in traders.
- Bollinger Bands: The tightening of Bollinger Band indicators intensifies the prevailing market sentiment’s uncertainty and emphasizes the necessity for a breakout to ascertain future movement.
Recent Posts
- Price Analysis
TSLA Stock Price Outlook as Stronger Than Expected Q1 Earnings Mask $173M Bitcoin Loss
Tesla (NASDAQ: TSLA) posted stronger-than-expected Q1 2026 earnings, driving a slight 0.28% gain in TSLA…
- Price Analysis
Is it Time to Exit XRP as CLARITY Act Passage Odds Hit a New Low?
XRP price has dropped by 2.4% today, April 23, after the odds of the CLARITY…
- Price Analysis
CRCL, BMNR, and COIN Stocks Price Prediction as CLARITY Act Hits April Roadblock
CRCL, BMNR, and COIN stocks moved higher as cryptocurrency markets extended their recent rebound. The…
- Price Analysis
Futures Data Signals XRP Price Breakout as $34B US Bank Opens XRP Deposits
XRP price has recorded an uptick in volatility today, April 22, with the price fluctuating…
- Price Analysis
Aave TVL Plunges Following KelpDAO Hack 15 Billion- What’s Next for AAVE Price?
Aave price hovered at $93.45 on Wednesday, rising 1.06% over the past 24 hours. The…
- Price Analysis
Crypto Market Today: BTC Breaks $78K, ETH Tests $2,400, XRP Soars to $1.45 as Trump Extends Iran Ceasefire
The crypto market is up today, April 22, with a 2.35% intraday gain in the…