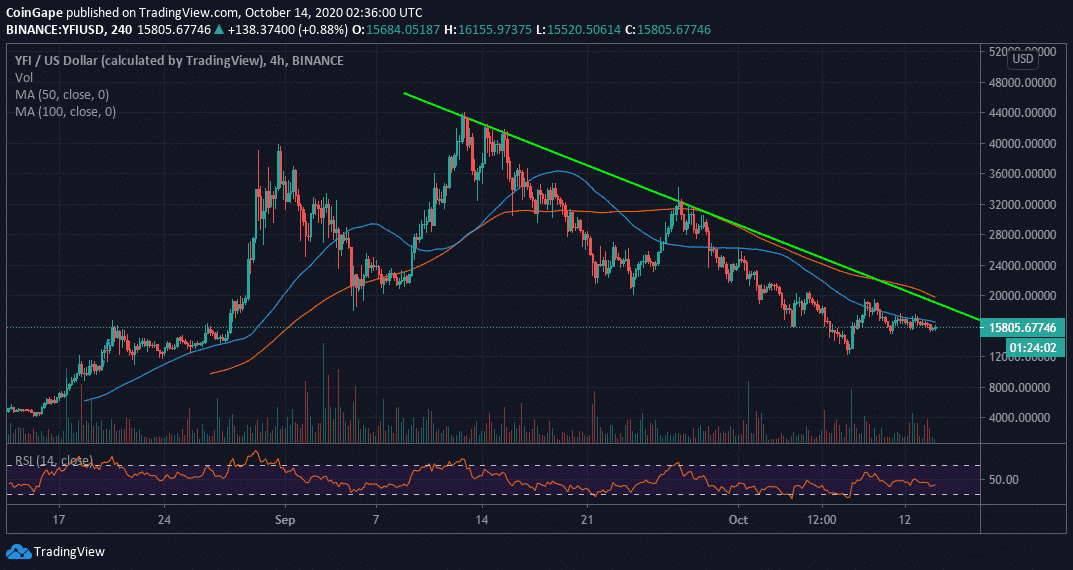
Yearn.finance has lost a great deal of its value since it traded an astronomical all-time high of $44,000. The 4-hour chart illustrates the several attempts made to regain the lost ground. However, buying pressure has continuously been thwarted. The biggest blow was the recent slide to $12,000. Luckily, buyers came to the rescue of the decentralized finance token.
A recovery ensued and tested the crucial level at $20,000. Several other critical zones remained unconquered, including the 50 Simple Moving Average (SMA), the long-term descending trendline, and the 100 SMA in the 4-hour timeframe.
Yearn.finance retreated again but this time, support seems to have been embraced above $15,000. The Relative Strength Index (RSI), nonetheless is forming a lower higher pattern, bringing into the picture the hovering selling activities.
It is essential that the 50 SMA resistance is broken soon to allow bulls to shift the focus to $20,000. However, the sellers’ grip is likely to continue intensifying putting more pressure on the short-term support at $15,000. Support at $12,000 is still intact and would hold in case an extended or sharp reversal comes into the picture.
IntoTheBlock’s IOMAP chart confirms the possible bearish scenario by revealing intense supply areas towards $20,000. The largest resistance zone runs from $16,363 to $16,831, where 46 addresses previously purchased 3,900 YFI.
On the downside, Yearn.finance is accorded relatively weak support as observed from the model. However, the strongest buyer congestion zone runs from $14,448 to $14,916. Here, 266 addressed previously purchased roughly 613 YFI.
Spot rate: $15,790
Relative change: 124
Percentage change: 0.84%
Trend: Bearish bias
Volatility: Low
Bitget has launched SPCXUSDT. The new IPO Pre-Market Perpetual Contract linked to SpaceX, SPCXUSDT will…
The CLARITY Act’s odds of passing before 2027 plummeted below 50% on prediction market platforms…
The U.S. Securities and Exchange Commission has approved Nasdaq's proposal to launch Bitcoin index options.…
The U.S. Securities and Exchange Commission (SEC) has postponed plans to develop rules for trading…
Another legal setback came for prediction market operators Kalshi and Polymarket. A federal appeals court…
Kevin Warsh has officially stepped up as the new chair of the U.S. Federal Reserve,…