Bitcoin and other crypto markets are facing the lowest volatility levels in history, with investors showing signs of extreme exhaustion. The largest crypto has in the last 24 hours dropped 0.5% to $29,168 with support at $29,000 likely to give in to attempts by bears to explore areas such as $28,000 and $25,000.
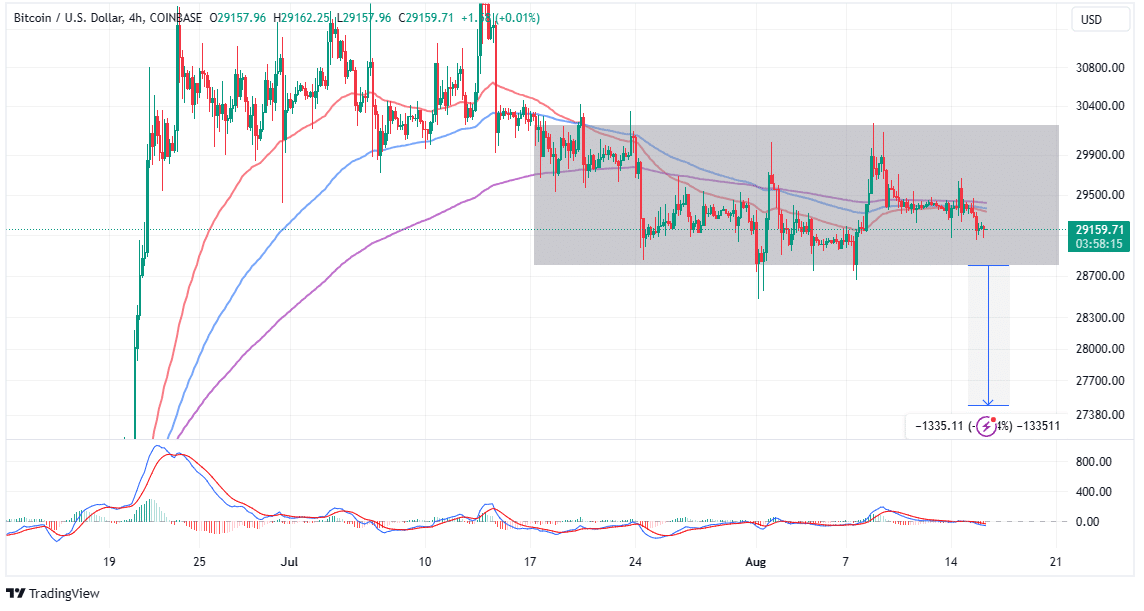
The technical outlook on the four-hour chart shows the formation of a rectangle pattern that could implode, leaving Bitcoin vulnerable to losses. This bearish pattern allows traders to identify breakouts and profit from downtrends in BTC price.
It occurs when the price moves sideways between two parallel horizontal lines, forming a rectangular shape.
This formation implies that the sellers and buyers are in a temporary balance, and the price is consolidating (between $28,800 and $30,200) before resuming its downward direction.
To trade the bearish rectangle pattern, traders look for a breakout below the lower support line at $28,800, which signals that the sellers have gained the upper hand and are ready to push the price lower.
A short entry can be placed after the breakout, with a stop loss above the resistance line and a profit target based on the height of the rectangle, in this case -4.64% to $27,469.
Validating the weakening market structure is the Moving Average Convergence Divergence (MACD) indicator, which currently dons a sell signal. This call to traders to seek short positions in BTC manifested with the MACD line in blue crossing below the signal line in red.
Besides, the momentum indicator holds below the mean line (0.00) indicating that sellers have the upper hand.
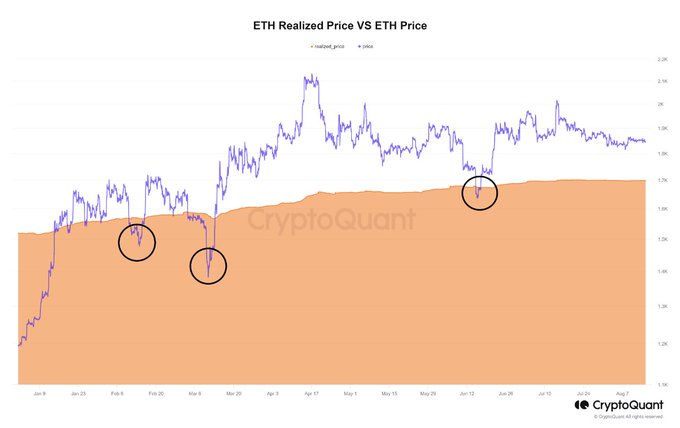
According to on-chain analytics firm Glassnode, “the digital asset market continues trading within a historically low volatility regime, with several metrics indicating extreme apathy and exhaustion has been reached in the $29k to $30k range.”
Based on the latest insights from Glassnode, “the Realized Cap is climbing, but only very slightly, suggesting a very boring, choppy, sideways market may remain on the road ahead,” with attributed to the dwindling market volatility.
Bitcoin has failed to sustain movement above $30,000 despite several attempts by the bulls. These failed attacks put pressure on support areas, especially at $29,000, and the rectangle lower boundary at $28,800.
Within the short-term market doldrums, BTC outbursts of volatility – are not beneficial for long-term holders but present opportunities for day traders to make a profit.
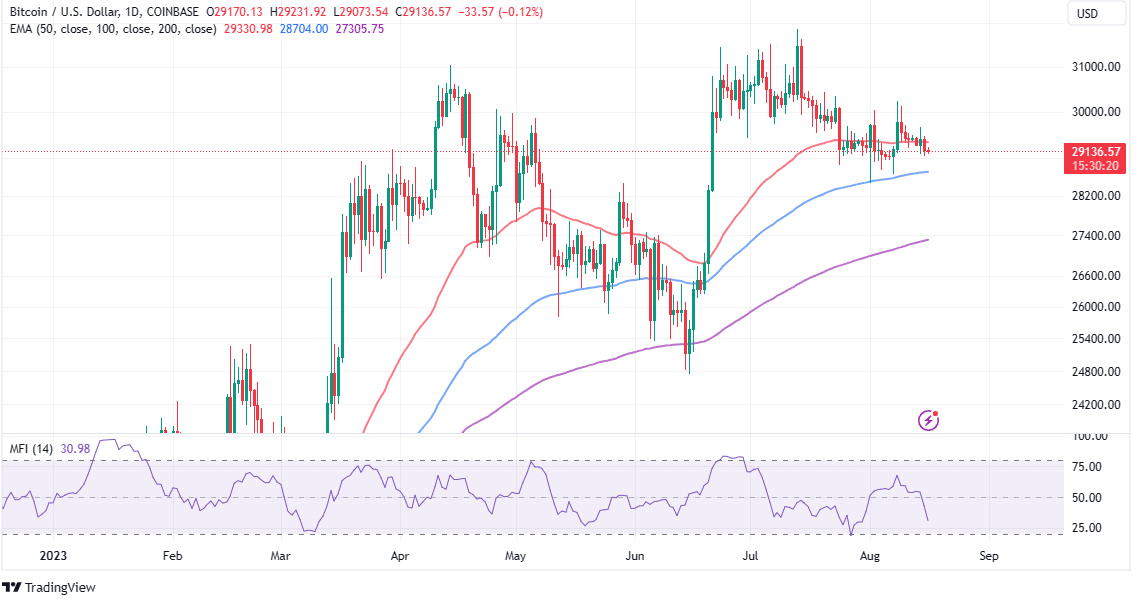
With that in mind, the Money Flow Index (MFI) indicator shows that the outflow of funds into BTC markets currently outweighs the inflow volume.
This means that an immediate recovery is highly unlikely unless bulls accept short-term pain to pave the way for Bitcoin to sweep through fresh liquidity at the $28,800 support – which almost coincides with the 100-day EMA (blue).
If the downward pressure on the $29,000 immediate support continues, traders will likely increase their exposure to BTC shorts, which could trigger a sell-off.
Movement, below $29,000 means a possible breakout at the rectangle pattern and continued declines to the target at $27,469. Other support areas to keep in mind include the 200-day EMA (purple) at $27,305 and the June lows around $25,000.
U.S. Treasury Secretary Scott Bessent indicated that the Trump administration is still pursuing a strategic…
Senator Cynthia Lummis strongly rebuked criticism from JPMorgan CEO Jamie Dimon regarding CLARITY ACT. She…
Citigroup analysts have weighed on the potential reasons for Bitcoin’s recent crash. They noted that…
The Zcash Foundation has released an emergency Zebra upgrade to fix the bug that disrupted…
Crypto asset manager Grayscale has filed an updated S-1 for its BNB ETF with the…
Crypto developers are receiving backing from a new political action committee (PAC), Defend Developers, that…