Apecoin Price Breaks $5.7 Barrier For A 14% Rally, But What Next?
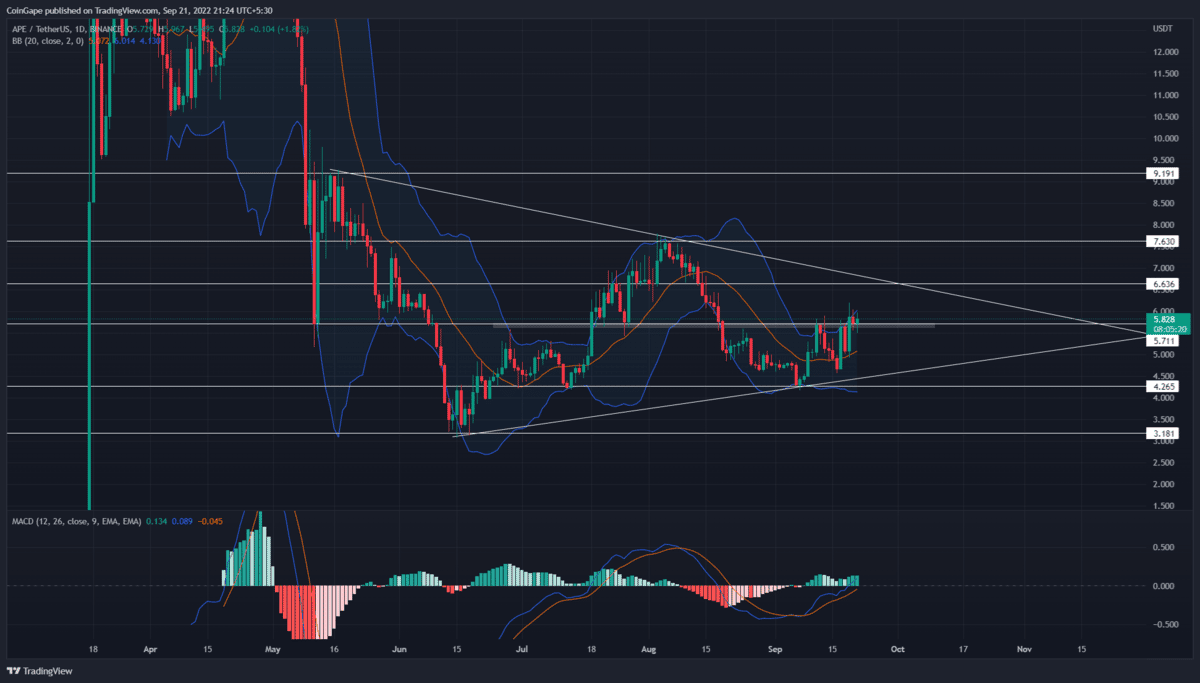
Following the May-June downtrend, the Apecoin price started walking a lateral path. Moreover, the altcoin resonating within two converging trendlines indicated the formation of an inverted pennant pattern. This symmetrical triangle-type consolidation shows a short break period for coin sellers before they continue the prevailing downtrend.
Key points from Apecoin price analysis:
- The APE price wobbling within a symmetrical triangle pattern will soon enter a no-trading zone
- The 20 and 50 EMA closing a bullish crossover in the daily timeframe chart
- The intraday trading volume in Apecoin is $385.2 Million, indicating a 36% loss
The ongoing bull cycle within this pattern was initiated when the prices rebounded from the support trendline on September 7th. However, after two weeks of struggles, the buyers have recently managed to breach the $5.6-$5.7 supply zone.
The coin chart showed two days of the retest phase in which the lower price rejection candle indicates a great entry opportunity. Thus, this flip support could increase the bullish momentum and drive the Apecoin price 14% higher to the shared resistance of $6.6 and a resistance trendline
Also read: Just-In: ApeCoin (APE) Community Gets Its Separate BAYC NFT Marketplace
Under the pattern’s influence, the Apecoin price will likely revert from the resistance trendline and make its way to the support trendline.
As per technical setup, a breakdown below the support trendline will trigger the inverted pennant pattern. Doing so will resume the prevailing downtrend, and at first, the potential downfall will drop to the June bottom support of $3.18.
On a contrary note, a triangle consolidation holds a possibility to breach the overhead trendline. If this theory worked out, the coin holders might witness a new recovery rally.
Technical Indicator
MACD indicator: with a significant gap, the fast and slow lines may soon enter bullish territory, boosting the buyer’s conscience in this recovery.
Bollinger band indicator: the coin price retesting the indicator’s upper band could stall the ongoing recovery or cause a minor retracement. However, until the prices sustain above the support trendline, the coin holder doesn’t have to panic.
- Resistance levels: $6.6 and $7.6
- Support levels: $5.7 and $5.1
Recent Posts
- Price Analysis
Will Cardano Price Rally as Hoskinson Confirms Revised CLARITY Act Recognizes ADA’s Non-Security Status?
Cardano (ADA) has increased by 11% since May 2026 started. These gains have come from…
- Price Analysis
XRP Price Prediction as XRPL Whale Wallets Hit Record High Ahead of Lending Protocol Update
XRP price touched $1.50 on May 10, and it might go back here or even…
- Price Analysis
Is XRP Price a ‘Buy’ Ahead of May 14 U.S. Crypto Bill Vote?
XRP price remained under pressure on Tuesday as investors prepared for a major U.S. regulatory…
- Price Analysis
Will Solana Price Rally After Alpenglow Upgrade Enters Validator Testing?
Solana price remained near $95 on Tuesday as traders watched the important $100 resistance level…
- Price Analysis
BTC Price Prediction as Ray Dalio Believes Bitcoin Still Isn’t a Safe-Haven Asset
Bitcoin (BTC) was trading at $80,614 at the time of writing. Concerns that CPI data…
- Price Analysis
Zcash Price Prediction After Grayscale Files First-Ever Spot Privacy Coin ETF
Zcash(ZEC) Price remains in focus after Grayscale filed to convert its Zcash Trust into a…