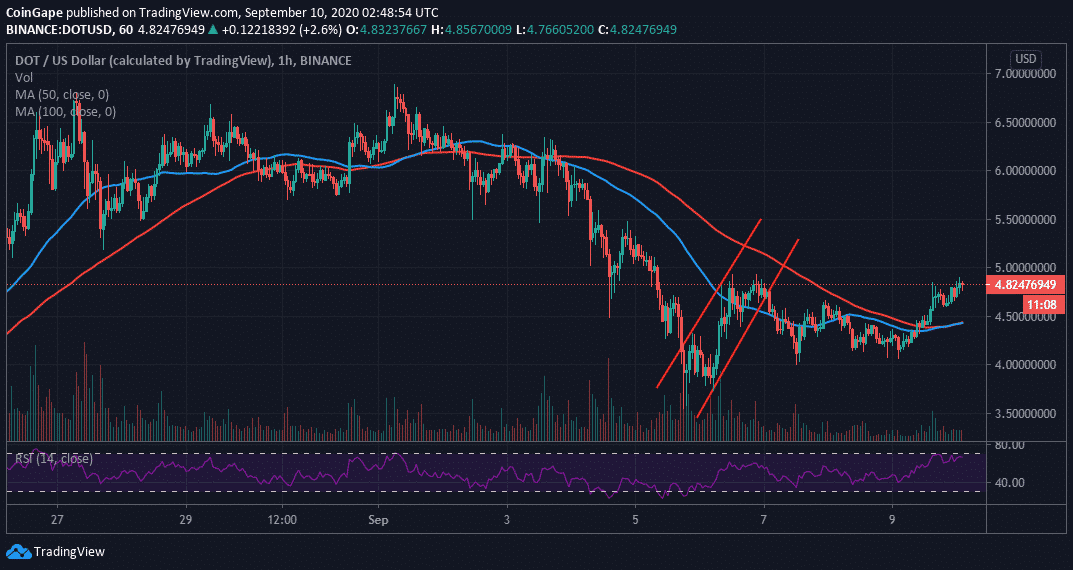
Polkadot broke down from the ascending channel, discussed last week. Luckily, support at $4.00 came in handy, preventing acute declines from taking over. A reversal, therefore, ensued with buyers increasing their entries. A break above both the 50 Simple Moving Average (SMA) and the 100 SMA in the 1-hour chart encouraged the bulls to increase their entries in anticipation of a rally towards $5.00. At the time of writing, DOT/USD is dancing at $4.80 amid a struggle to overcome the short term resistance at $5.00.
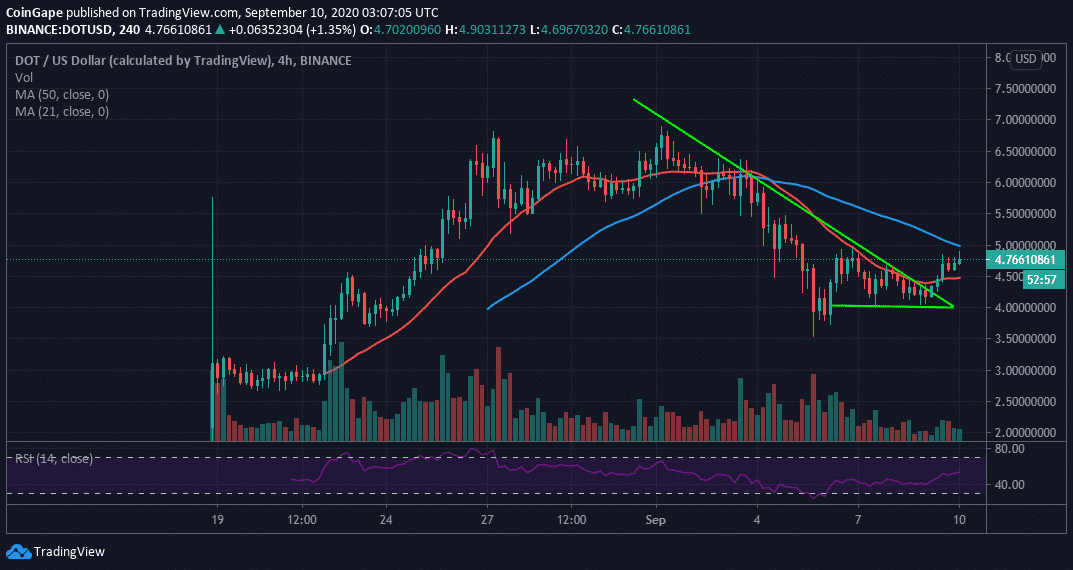
The 4-hour chart, prints a bullish picture for DOT/USD, especially after a breakout above a falling triangle pattern. Triangle patterns are some of the most common technical analysis tools. They help the traders predict a change from the prevailing trend and the extent to which the new trend can reach. In this case, the triangle breakout is likely to catapult DOT above $5.00.
Subsequently, a break above the resistance at the 50 SMA would boost the price farther north. According to the Relative Strength Index (RSI), the uptrend is strong enough for a break above $5.00 in the near term. It t seems lack of enough volume is holding Dot from making a drastic spike. In other words, many are not believing that Polkadot is set for that significant move. This is most likely to invalidate the buy signal. Therefore, is it essential to hold on for a confirmed breakout, especially past the 50 SMA, before going all-in on DOT.
Spot rate: $4.77
Relative change: 0.0682
Percentage change: 1.50
Trend: Short tern bullish bias
Volatility: Expanding
On Tuesday, Ethena's native token ENA rallied by almost 10%. The surge came after the…
Senators Elizabeth Warren and Bernie Sanders, and Rep. Robert Scott, are pushing for the Labor…
U.S. President Donald Trump has signed an AI executive order that aims to create frameworks…
Galaxy Digital has made a $10 million prediction market trade based on the result of…
Ripple on Tuesday said it has opened a new office in downtown Washington, D.C. The…
Standard Chartered's Global Head of Digital Assets Research, Geoffrey Kendrick, has predicted that Ethereum could…