Ethereum Price Analysis: ETH Price Nurtures Uptrend to $2,500; Brushes Shoulders with $2,200

- ETH price holds onto crucial support at $2,100 after trading a record high at $2,200.
- Consolidation is likely to increase based on the MACD.
ETH Price reclaimed the position above $2,000 last week after a correction that tested the support at $1,930. Numerous buy orders were triggered, allowing bulls to push for new all-time highs. ETH price shot upward, but the momentum fizzled out, hitting a barrier at $2,200.
Ethereum Price Analysis: ETH/USD 4-hr chart
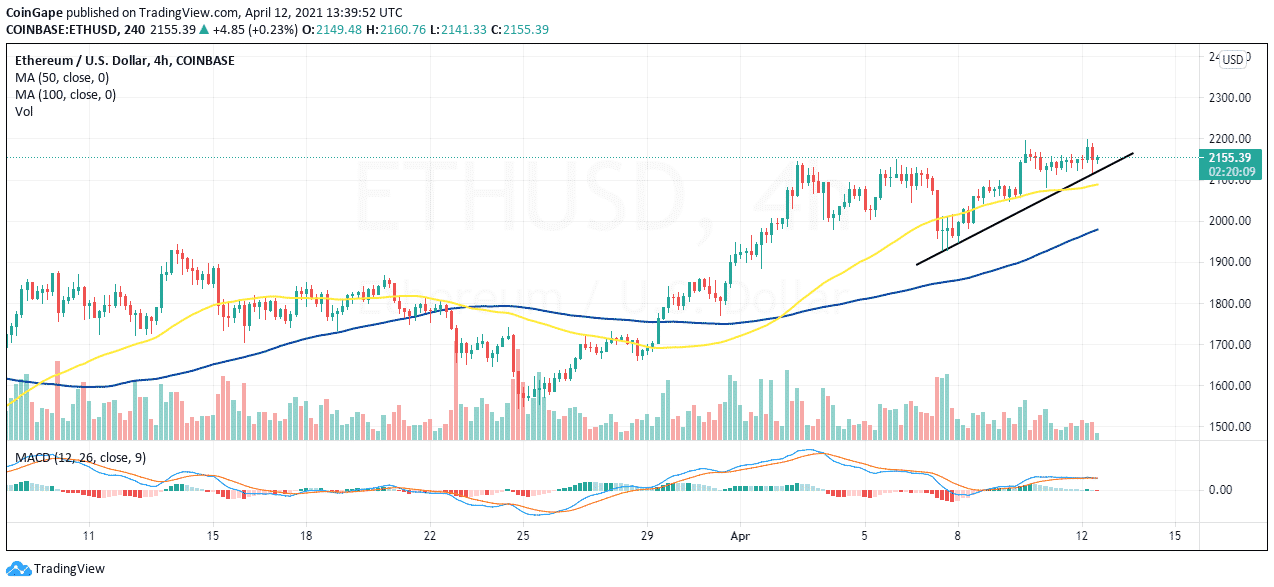
A break above the record high of $2,200 would lead to more buy orders as investors join the market. Speculation is likely to shoot as Ethereum heads toward another high at $2,500. Many –technical analysts believe that ETH price is not done with the spike to new highs. Gains past $2,500 will bring it close to $2,700.
Ethereum Eyes Consolidation
At the time of writing, Ether exchanges hands at $2,150 after recovering from the support established at $2,100. The 50 Simple Moving Average (SMA) also contributed to the support. For now, this buyer congestion zone is key to the uptrend.
The Moving Average Convergence Divergence (MACD) indicator suggests that Ethereum has settled for sideways trading action. This indicator identifies positions to buy the dip and sell the top. As the MACD line cross above the signal line, traders are advised to buy. On the other hand, crossing under the signal line implies that ETH price is falling fast into the bears’ hands.
Meanwhile, the MACD levels at 24, hinting at the trend remaining sideways in the short term. Traders should look out for the direction the indicator makes to trade Ethereum properly. However, the MACD cannot be used on its own and needs the support of other indicators or technical patterns.
ETH Price Intraday Levels
- Spot rate: $2,150
- Trend: Consolidation
- Volatility: Low
- Support: $2,100, $2,000 and $1,900
- Resistance: $2,200
Recent Posts
- Crypto News
MrBeast Over Ethereum? Is ETH Treasury Firm Bitmine In Trouble As Investors Rush to Sell BNMR Stock
Ethereum treasury company BitMine has faced some criticism over its $200 million investment in MrBeast's…
- Crypto News
Why Crypto Companies Like Coinbase Are Not Supporting Crypto Market Structure Bill Anymore
Among the key players in the industry, the support of the U.S. crypto market structure…
- Crypto Reviews
Nexo Card Review For 2026 – A Dual Purpose Mastercard
The Nexo card allows its holder to use it as a regular card without losing…
- Crypto News
Institutional Bitcoin Futures Activity Climbs Ahead Of Senate’s CLARITY Act Markup
Institutional involvement in Bitcoin continues to grow as they appear to be gaining confidence. Their…
- Crypto News
BlackRock Makes Multiple BTC Withdrawals as Bitcoin Price Slips to $95K, Is a Sell-Off Coming?
BlackRock has reportedly pulled out some of its BTC from its Coinbase account. This comes…
- Crypto News
XRP News: Ripple Teams Up With UC Berkeley to Boost Institutional Use on XRPL
In the latest XRP News, Ripple has partnered with UC Berkley in a bid to…