

EOS Price Analysis: A Declining Volume Indicates Consolidation; Time To Buy?


EOS price analysis indicates the continuation of a price correction. The spectacular rise in the price attracted the sellers and initiate a distribution near the supply zone.
As of press time, EOS/USD is exchanging hands at $1.70, down 5.14% for the day. The 24-hour trading volume declined more than 50% below $ 8 billion. A fall in price along with the volume is a weakening downside trend.
- EOS price edges lower for the second straight session.
- A decisive break below $1.70 would bring more losses to the coin.
- A red candlestick indicates the dominance of the sellers.
EOS price turns south
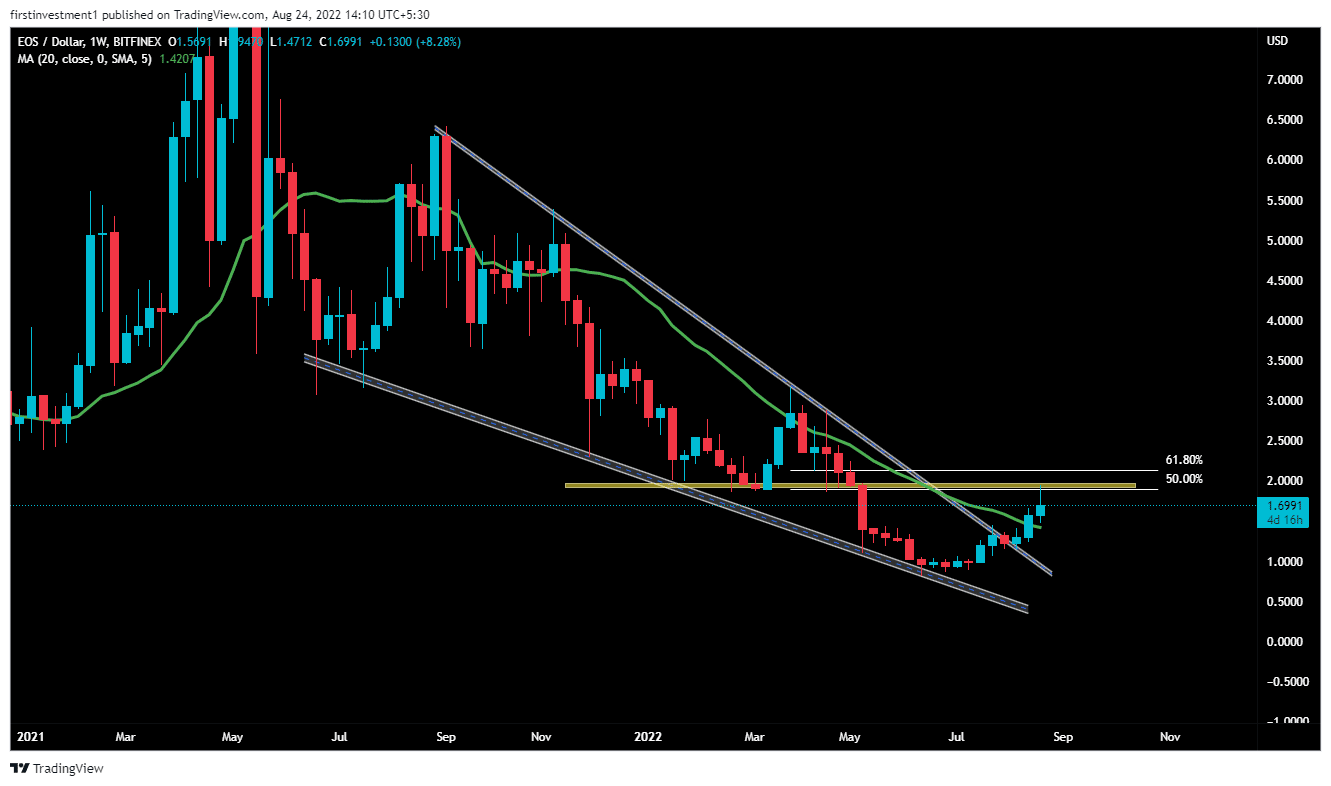
On the weekly chart, the EOS price gave a breakout of a “Falling Wedge” pattern. The falling wedge can be one of the most difficult chart patterns to accurately recognize and trade.
When lower highs and lower lows form, as in a falling wedge, security remains in a downtrend. The falling wedge is designed to spot a decrease in downside momentum and alert technicians to a potential trend reversal.
The price gave a breakout of the 200-day exponential moving average & trading above it. The asset is making lower lows and lower highs formation.
The recent price action implied a bearish impulse move from March 28 ($3.18) to June 13 ($0.80). Amid pullback the price test 50% Fibonacci retracement, which will act as a hurdle (resistance) in the coming days. If the price is able to break above ($1.95), then we can expect a good bullish momentum of ($2.4).
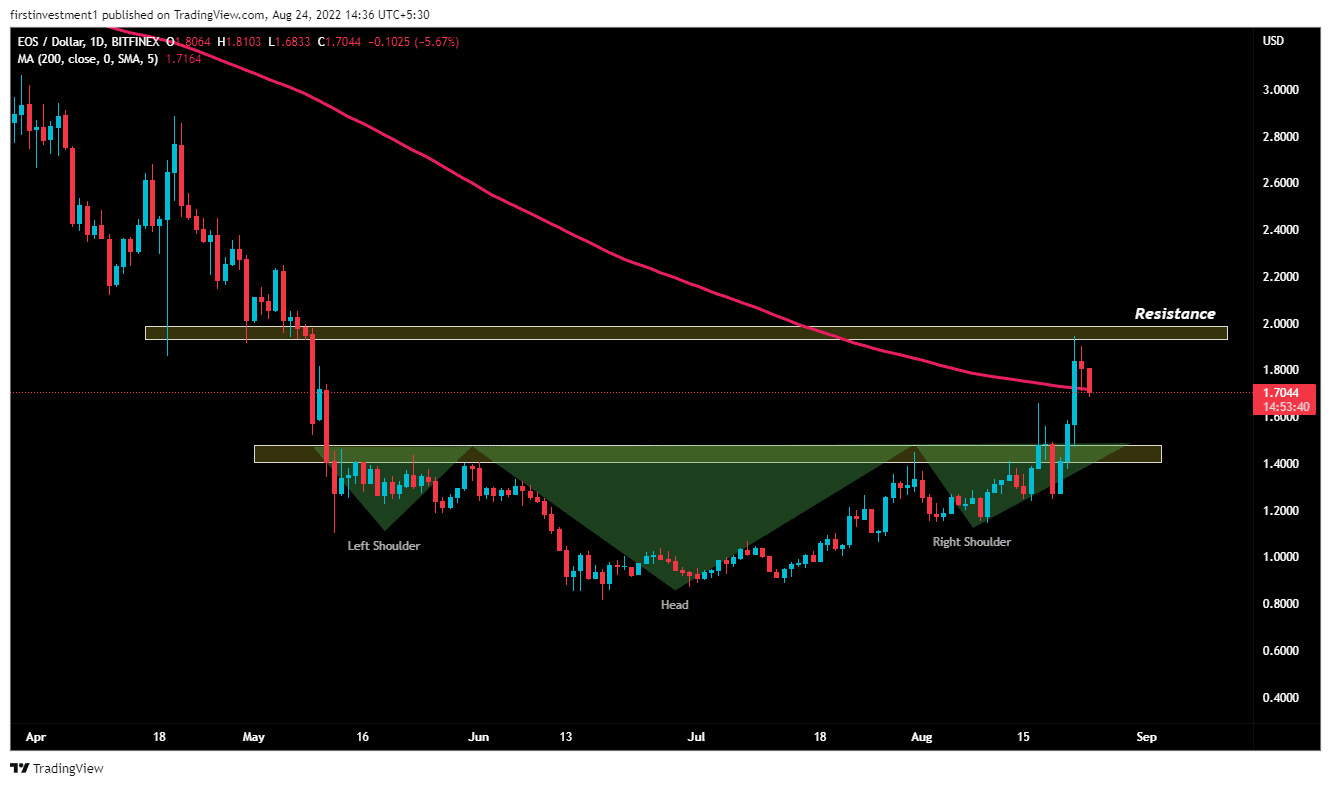
On the daily chart, EOS has given a breakout of an inverted “Head & Shoulder” pattern, & after that gave an impulse move of more than 50% from $1.26 to $1.94.
Further, the price gave a breakout of the 200-day exponential moving, but couldn’t sustain above that level due to resistance on the weekly chart, as mentioned above. If the price close below ($1.600), then we can expect a good fall, otherwise, a possible reversal is expected in the coming days.
Also read: https://Bombshell: Fed President Admits To Wanting Recession, Should You Panic
The nearest support is ($1.60), whereas the most immediate resistance is around ($1.80). There is a higher probability of the price breaking its resistance on higher levels.
But, due to the spike in sell orders if the price come closer to its support, then we can have a “Buy on dips” Opportunity.
On the other hand, a break below the $1.60 level could invalidate the bullish outlook. And the price could fall toward $1.50.
EOS is giving mixed signals on different time frames. Below $1.60 closing on the hourly time frame, we can put a trade on the sell side.

Why Trust CoinGape
CoinGape has covered the cryptocurrency industry since 2017, aiming to provide informative insights Read more…to our readers. Our journal analysts bring years of experience in market analysis and blockchain technology to ensure factual accuracy and balanced reporting. By following our Editorial Policy, our writers verify every source, fact-check each story, rely on reputable sources, and attribute quotes and media correctly. We also follow a rigorous Review Methodology when evaluating exchanges and tools. From emerging blockchain projects and coin launches to industry events and technical developments, we cover all facets of the digital asset space with unwavering commitment to timely, relevant information.
Premium Partners


Related Articles


- BlackRock Deposits Millions in Bitcoin and Ethereum as CryptoQuant Flags Growing Bear Market Risk
- NiceHash Review: Trade HashRate and effectively manage your POW mining facility
- US SEC Deliberates Nasdaq Bitcoin Index Options Approval amid Rising Derivatives Demand
- Arthur Hayes Moves Another 682 ETH To Binance: A Major Sell-Off Ahead?
- Is XRP Selling Pressure Easing? Here’s What On-Chain Data, ETF Flows Signal
- Pi Network Analysis: Pi Coin Price Surges on Christmas Eve, Can It Hit Year-End Highs?
- Why Dec 26th Is A Do Or Die for Bitcoin Price Ahead Of Record Options Expiry?
- Why Bitcoin, Ethereum And XRP Prices Are Down Today? (24 Dec)
- XRP Price Prediction: Will 4 Billion Transactions Spark Next Rally?
- Solana Price Outlook: Will SOL Recover With Strong Institutional Buying?
- Ethereum Price Risks Crash to $2,500 Amid Sustained Wintermute Dumping


