

After Falling 27% EOS Price Recovers Toward $1.50; Time To Enter?


EOS price recovers to test the critical $1.50 mark but could not sustain the gains. The price is trading in red for the past few hours. The bulls attempted to breach the downtrend in the previous session but the upside pressure remains intact.
- EOS price edges lower as the selling pressure persists near the higher levels.
- A daily candlestick below $1.45 could instill more downside pressure in the coin.
- Bullish formation on the daily chart suggests the price take a turnaround near the current level.
As of press time, EOS/USD is reading at $1.46, down 2.11% for the day. The 24-hour trading volume fell more than 6% to $296,250,463 according to CoinMarketCap data.
EOS price trades near critical level
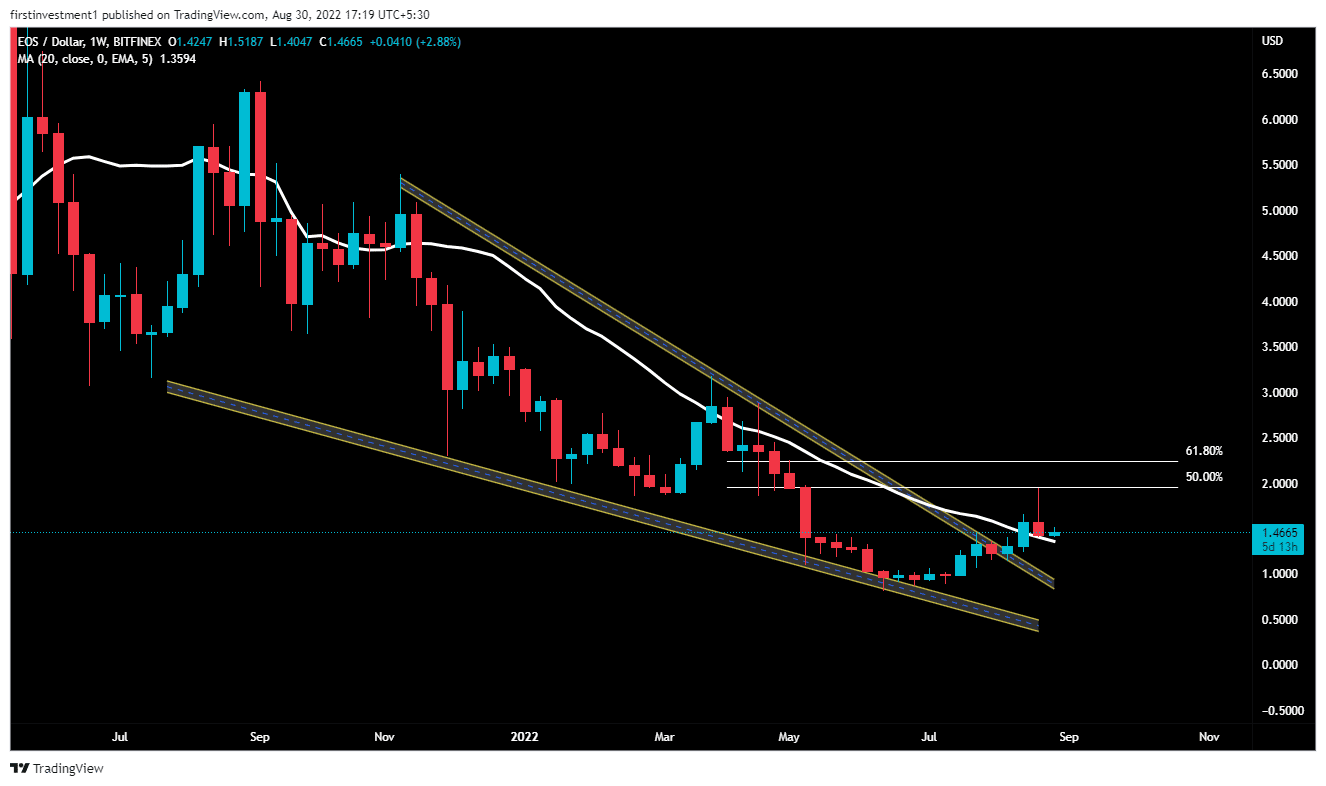
EOS on the weekly chart gave a breakout of a “Falling Wedge” pattern. The falling wedge can be one of the most difficult chart patterns to accurately recognize and trade.
This also coincides with the breach of the 20-day exponential moving average. Recently, the price gave a bearish impulse move from March 28 ($3.18) to June 13 ($0.809). The price gave a pullback from its swing lows and test the 0.5% Fibonacci retracement, which will act as a hurdle (Resistance) in the coming days.
Now, if the price is able to break above ($1.60) & gave a closing on daily charts, then we can expect a good bullish momentum of ($2.0).
Further, the daily chart gave a breakout of a bullish “Head & Shoulder” pattern, followed by an impulse move of more than 50% from $1.26 to $1.94.
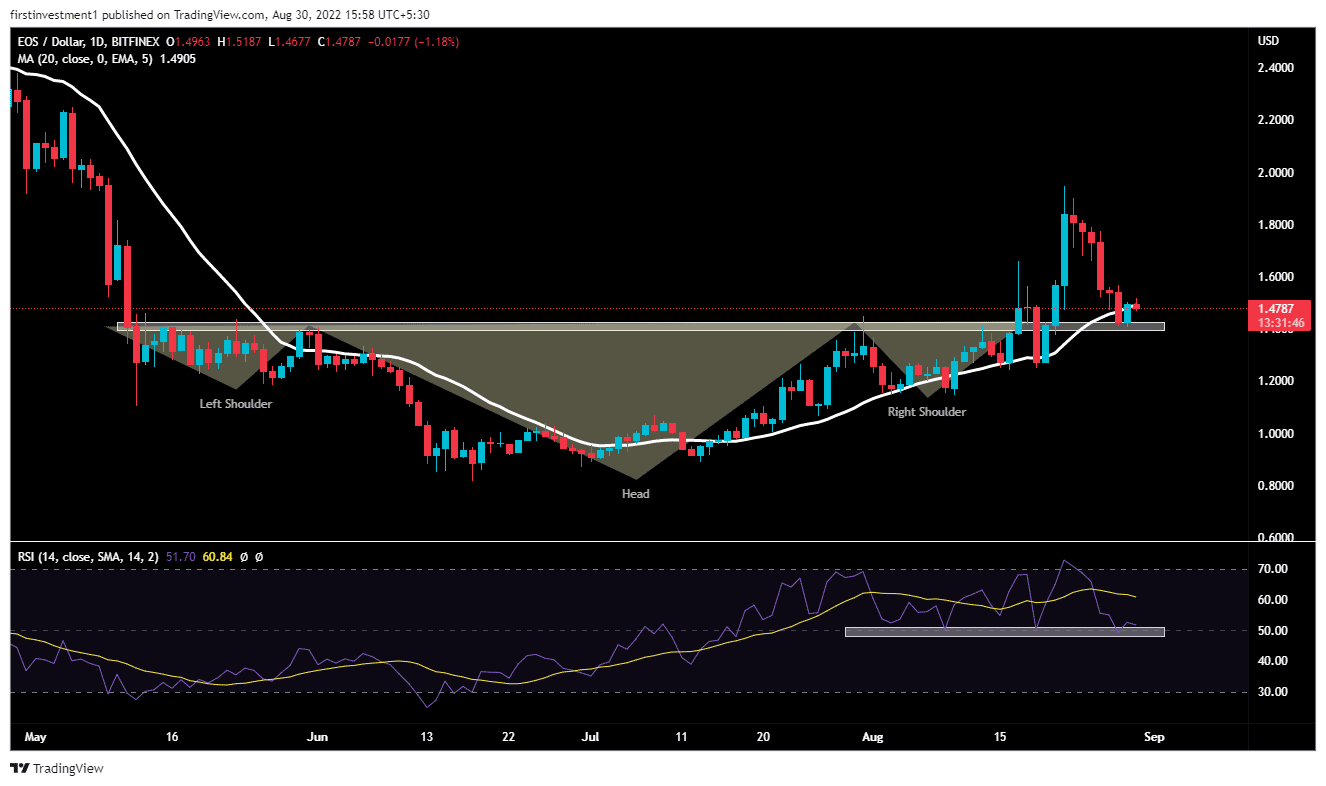
Currently, the price is retesting the neckline ($1.42). If the price gave closing above ($1.55) on the daily chart, then we can expect a good bullish momentum of up to ($1.700).
The bullish “Gartley Harmonic” formation in a shorter time is a short-term reversal pattern. This forms when the price starts to rise from 78.6% of the Fibonacci retracement of its previous trend.
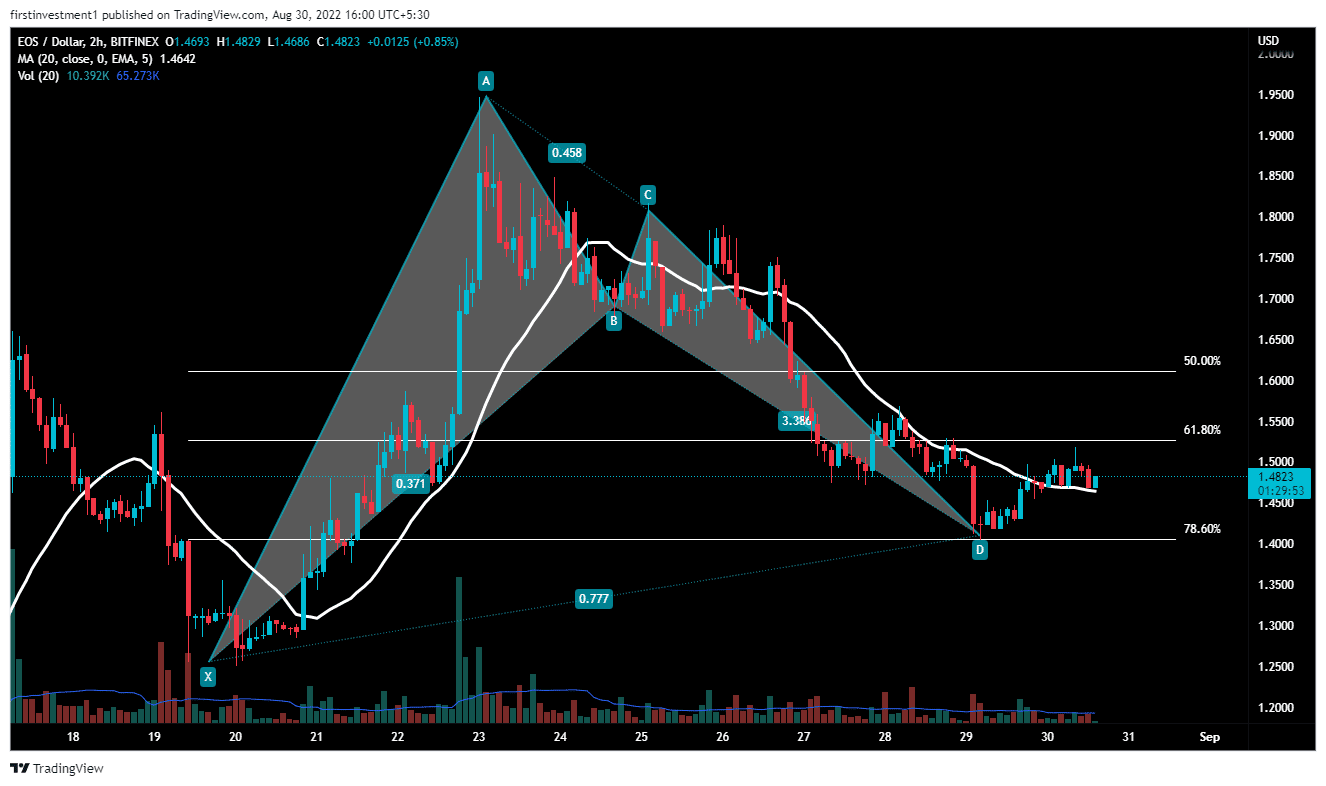
The short-term rise, we can expect according to this pattern is between $1.64 – $1.74, only if the price gave an hourly closing above $1.52.
The nearest support is ($1.40), whereas the nearest resistance is around ($1.52). There is a higher probability of the price breaking its resistance. But, if any chance price tends to come close to its support, and we’ve seen any rejection there, then we can buy there as well the “Buy on dips” opportunity.
On the other hand, a break below the $1.40 level could invalidate the bullish outlook. And the price fell below $1.30.
EOS is mildly bullish on all time frames. Above $1.52 closing on the hourly time frame, we can put a trade on the buy side.

Why Trust CoinGape
CoinGape has covered the cryptocurrency industry since 2017, aiming to provide informative insights Read more…to our readers. Our journal analysts bring years of experience in market analysis and blockchain technology to ensure factual accuracy and balanced reporting. By following our Editorial Policy, our writers verify every source, fact-check each story, rely on reputable sources, and attribute quotes and media correctly. We also follow a rigorous Review Methodology when evaluating exchanges and tools. From emerging blockchain projects and coin launches to industry events and technical developments, we cover all facets of the digital asset space with unwavering commitment to timely, relevant information.
Premium Partners


Related Articles


- Arthur Hayes Moves Another 682 ETH To Binance: A Major Sell-Off Ahead?
- Is XRP Selling Pressure Easing? Here’s What On-Chain Data, ETF Flows Signal
- Crypto Bill: Spain Pushes Ahead with MiCA and DAC8 As US Trails Behind
- Breaking: Grayscale Files Updated S-1 for its Avalanche ETF with the US SEC
- Bitcoin Price Will Never Rise: Peter Schiff
- Why Dec 26th Is A Do Or Die for Bitcoin Price Ahead Of Record Options Expiry?
- Why Bitcoin, Ethereum And XRP Prices Are Down Today? (24 Dec)
- XRP Price Prediction: Will 4 Billion Transactions Spark Next Rally?
- Solana Price Outlook: Will SOL Recover With Strong Institutional Buying?
- Ethereum Price Risks Crash to $2,500 Amid Sustained Wintermute Dumping
- Is It Time to Sell Bitcoin for Gold- Analyst Spots 2023 Pattern That Triggered BTC’s Last Major Rally


