

Bearish Pattern Lurking On Quant Coin Tease A Breakdown Below $87.3


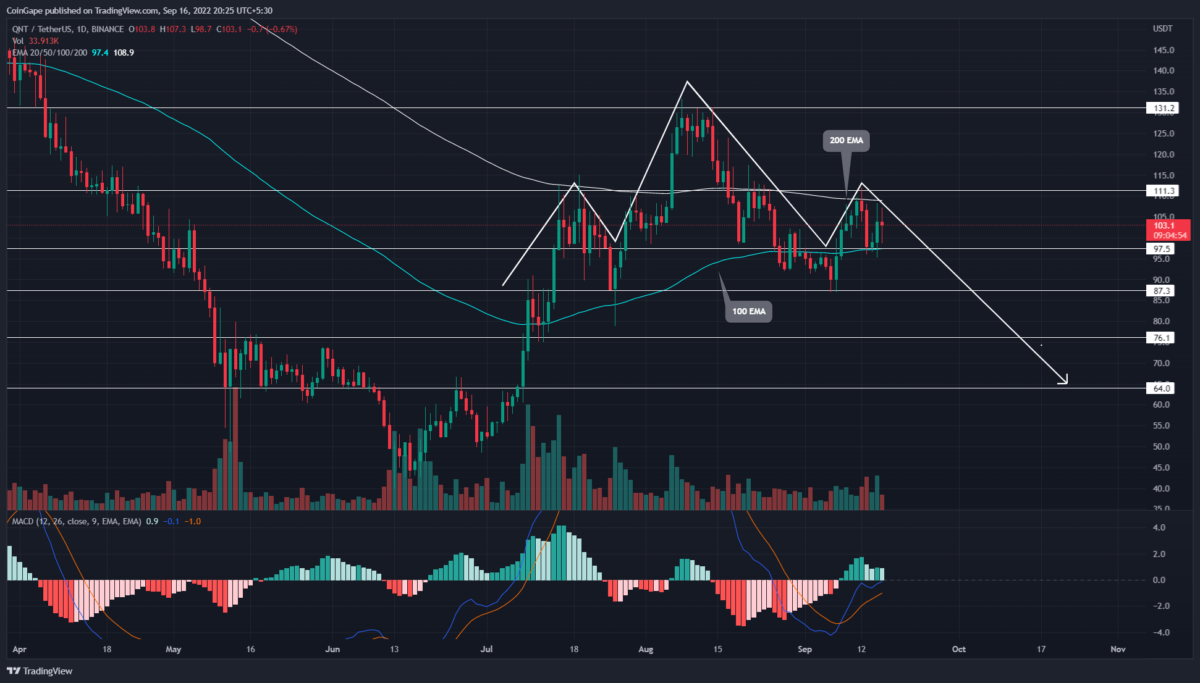
The Quant price daily technical chart shows a head and shoulder pattern formation. In theory, this pattern indicates a trend reversal where the price action shows higher high peaks shifting to lower lows. Thus, this pattern displays itself as a central swing high(Head) between the two shorter swing highs(shoulders).
Key points from Quant price analysis:
- With the influence of head and shoulder patterns, the Quant price could breakdown from $87.3 neckline support
- A breakout above the $111.3 resistance will invalidate the bearish thesis
- The intraday trading volume in the Quant is $49.5 Million, indicating a 77% gain
 Source-Tradingview
Amid the recent sell-off in the crypto market, September’s second-week recovery turned down from the 11.3 resistance, forming the right shoulder of the pattern. The downfall plunged the prices 12.5% lower to hit a local support zone of $97.5.
Furthermore, the formation of a bullish morning star candle pattern at this support offers an opportunity to offset the bearish pattern. However, the candle shows a long price rejection on both ends of the daily candle, indicating uncertainty among market participants.
Therefore, the Quant price is currently a make-or-break situation. A breakout from above $111.3 will undermine the bearish pattern and bolster buyers to rechallenge the swing high resistance of $131.2 resistance.
However, if the selling pressure persists, a breakdown below $97.5 will further encourage pattern completion. An $87.3 is the pattern’s neckline support, and a daily candle closing below it will extend the Quant price fall to the $64 mark.
Technical Indicator.
EMAs: the 100-day EMA aligned with $97.5 support and the 200-day EMA with $111.3 resistance gives more weightage to the short range and conditions mentioned above.
MACD indicator- The fast and slow lines wavering just below the neutral zone indicates the sellers still possess trend control. Moreover, the faded green bars in the histogram chart hint buying activities are weak.
Quant Price Intraday Levels
- Spot rate: $103
- Trend: Bearish
- Volatility: High
- Resistance level- $113 and $131.2
- Support levels- $97.5 and $87.3

Why Trust CoinGape
CoinGape has covered the cryptocurrency industry since 2017, aiming to provide informative insights Read more…to our readers. Our journal analysts bring years of experience in market analysis and blockchain technology to ensure factual accuracy and balanced reporting. By following our Editorial Policy, our writers verify every source, fact-check each story, rely on reputable sources, and attribute quotes and media correctly. We also follow a rigorous Review Methodology when evaluating exchanges and tools. From emerging blockchain projects and coin launches to industry events and technical developments, we cover all facets of the digital asset space with unwavering commitment to timely, relevant information.
Premium Partners


Related Articles


- Crypto Gains New Use Case as Iran Turns to Digital Assets for Weapon Sales
- Bitcoin Could Rally to $170,000 in 2026 If This Happens: CryptoQuant
- Lighter Team Under Fire After Alleged $7.18M LIT Token Dump Post-Airdrop
- Binance Market Maker Hack: Trader Rakes in $1M via Failed BROCCOLI Price Manipulation
- Breaking: UK Begins New Initiative to Crack Down on Crypto Tax Evasion
- Shiba Inu Price Eyes a 45% Rebound as Burn Rate Spikes 10,700%
- Expert Predicts Ethereum Price Rebound to $4k as BitMine, Long-Term Holders Buy
- Bitcoin Price Prediction Ahead of FOMC Minutes
- U.S. Government Shutdown Looms: These 3 Crypto Predictions Could Explode
- Grayscale Files for First U.S. Bittensor ETF: Will TAO Price Rally to $300 in January?
- Shiba Inu Price Prediction: Will SHIB Show Golden Cross Signal in 2026?


