

Apecoin Price Triggers A New Bear Cycle Within This Pattern; Buy Again?


In our previous Apecoin price analysis, we accounted for the formation of an inverted pennant pattern and how it will influence the coin’s future price. Currently, the coin price trades at the $5.6 mark and indicates an intraday growth of 4.26%. The altcoin’s recent reversal from the resistance trendline means ongoing consolidation will last for a few more sessions.
Key points:
- The APE price breakdown from $5.7 will encourage an 18.5% drop
- However, a Low high retest to the breached $5.7 support suggest weakness in bearish momentum
- The intraday trading volume in Apecoin is $213.2 Million, indicating a 4.78% gain
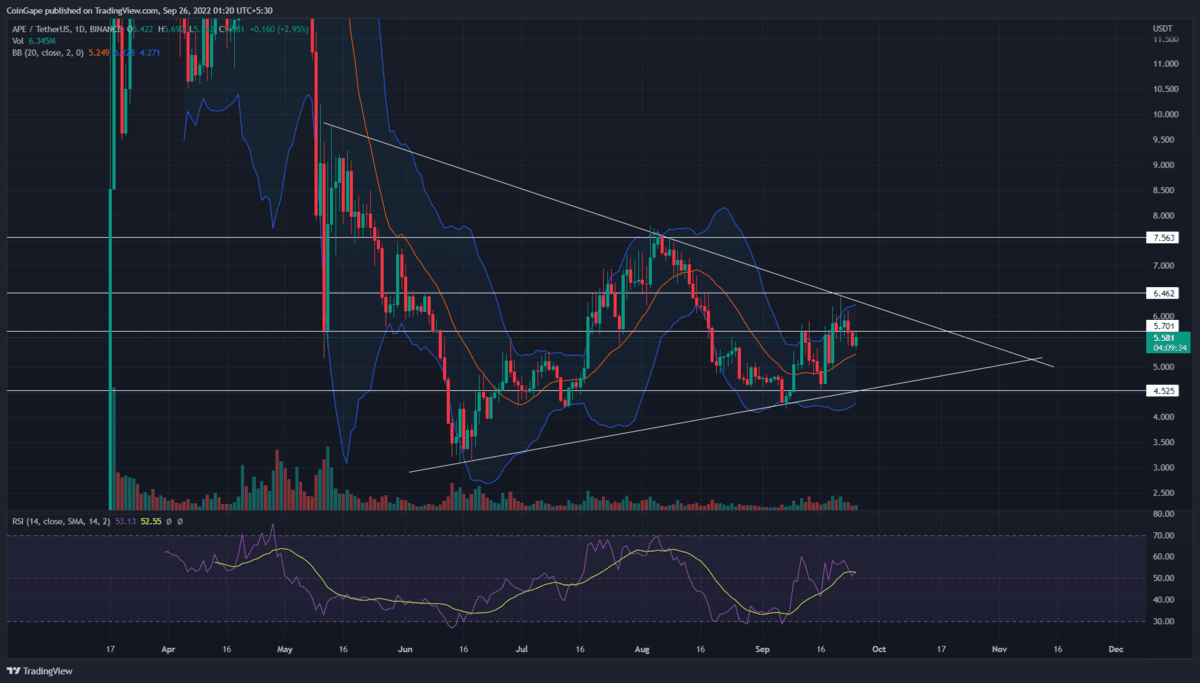
 Source- Tradingview
Under the influence of an inverted pennant pattern, the Apecoin price travels in a sideways rally within the two converging trendlines. On September 21st, the coin price retested the resistance trendline, replenishing the bearish momentum.
Moreover, earlier this week, the daily chart showcased several higher price rejections at this level, indicating high supply pressure. As a result, the Apecoin price reverted from this trendline, initiating a new bear cycle within the triangle pattern.
Also read: Just-In: Horizen Announces Final Date For ApeCoin Staking, APE Price Jumps
Furthermore, the bearish reversal gave a strong breakdown from the local support zone of $5.7. Today, the altcoin is bullish and retests the breached support as potential resistance. If the sellers sustain the prices below $5.7, the prices will extend the ongoing consolidation and plunge prices to the support trendline.
In theory, Apecoin should eventually break the bottom trendline to resume its prior downfall.
On a contrary note, if the coin buyers manage to break the above trendline, the market participants may witness a new recovery rally.
Thus, the Apecoin prices wobble in a no-trading zone, and new buyers should wait for a pattern breakout before entering the market.
Technical Indicator
RSI: the daily-RSI slope maintain above the midline indicates the market sentiment is bullish
Bollinger band indicator: the coin price could obtain sufficient from the indicator’s midline and extend the bullish trend.
Apecoin Price Intraday Levels
- Spot rate: $5.58
- Trend: Bullish
- Volatility: High
- Resistance levels: $5.7 and $6.46
- Support levels: $4.5 and $3.2

Why Trust CoinGape
CoinGape has covered the cryptocurrency industry since 2017, aiming to provide informative insights Read more…to our readers. Our journal analysts bring years of experience in market analysis and blockchain technology to ensure factual accuracy and balanced reporting. By following our Editorial Policy, our writers verify every source, fact-check each story, rely on reputable sources, and attribute quotes and media correctly. We also follow a rigorous Review Methodology when evaluating exchanges and tools. From emerging blockchain projects and coin launches to industry events and technical developments, we cover all facets of the digital asset space with unwavering commitment to timely, relevant information.
Premium Partners


Related Articles


- Crypto ETFs in 2026: What to Expect for Bitcoin, Ethereum, XRP, and Solana
- BlackRock Moves $200M BTC and ETH as Crypto ETPs See $3.2B Outflows Since October 10 Crash
- Breaking: Tom Lee’s Bitmine Buys $130M in ETH as Ethereum Whales Now Control 70% of Supply
- Breaking: Michael Saylor’s Strategy Buys 1,229 BTC as Bitcoin Heads Toward a 2025 Loss
- ETH Treasury: Trend Research Uses USDT Loans to Expand Holdings to $1.8B, Eyes 2026 Bull Run
- SUI Price Forecast: What’s Next for SUI in 2026 After $78.9M Token Unlocks?
- Solana Price Prediction: How High Could SOL Go in January 2026?
- Top 3 Predictions for Bitcoin price, Ethereum price and XRP price for 2026 According to Analysts
- Is $1 Dogecoin Price Technically Possible in 2026?
- Bitcoin Price Year-End Prediction: Analysts Highlight Key Levels Before 2025 Close
- Pi Network Price Holds $0.20 After 8.7M PI Unlock, 19M KYC Milestone-What’s Next?


