Golden Crossover Encourages Quant Coin Buyers To Reclaim $155 Barrier


Concerning the last seven months’ price action, the Quant coin chart showed the formatting of an inverted head and shoulder pattern. This bullish reversal is often spotted at the market bottoms, indicating a switch in market sentiment from selling on rallies to buying on dips. Furthermore, the coin buyers have recently breached the neckline resistance of this pattern, offering a recovery opportunity for coin holders.
Key points:
- A parabolic growth in quant price should 65.3% rally within a month
- The 50-and-200 EMAs are on the verge of a bullish crossover
- The intraday trading volume in the Quant is $32 Million, indicating a 6% gain
 Source-Tradingview
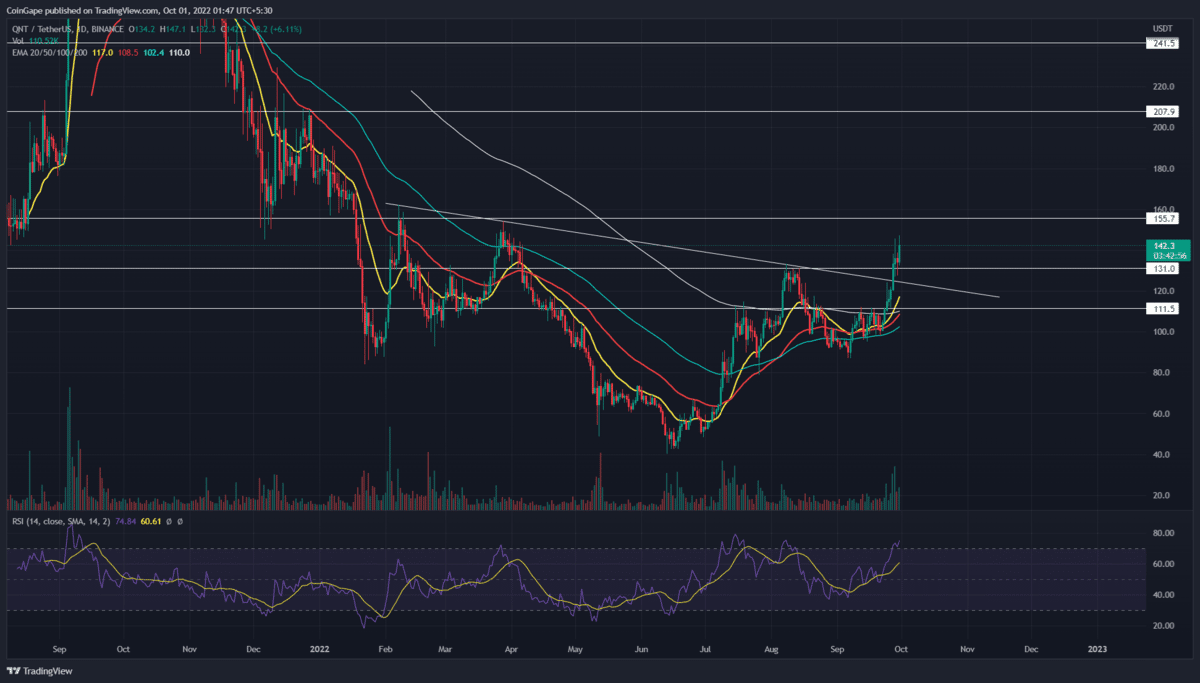
Despite ongoing uncertainty in the crypto market, the Quant price gave a massive breakout from the resistance trendline on September 27th. The following two days, the altcoin buyers tried to sustain above the breached trendline and the $131 level.
Furthermore, the lower price rejection attached to these retest candles indicates the buyers are obtaining sufficient support at this level. Thus, the flipped support bolstered an 8.5% jump today, offering a follow-up on chart pattern breakout.
The Quant price currently trades at the $144 mark, and with sustained buying, the prices should hit the immediate resistance of $155. Furthermore, a possible breakout from this monthly resistance will provide a higher floating for buyers and prolong the ongoing recovery.
Anyhow, under an ideal bullish scenario, the expected target for the H&S pattern is the distance of the same point between the neckline and head tip. Thus, altcoin should rise to a comparatively close target of $208.
On a contrary note, if the coin price turned down from the $155 resistance and dived below $131, the bullish thesis would get invalidated.
Technical Indicator.
EMAs- an upswing in crucial EMAs(20, 50, and 100) indicates early signs of a trend reversal. Moreover, the 50-and-200-day EMAs are poised for bullish crossover should accelerate the buying pressure.
RSI indicator- The daily-RSI slope quite close to the overbought region indicates a price retracement is needed to sustain the coin prices.
Quant Coin Price Intraday Levels
- Spot rate: $144
- Trend: Bullish
- Volatility: low
- Resistance levels- $155 and and $175
- Support levels- $131 and $111
Why Trust CoinGape
CoinGape has covered the cryptocurrency industry since 2017, aiming to provide informative insights Read more…to our readers. Our journal analysts bring years of experience in market analysis and blockchain technology to ensure factual accuracy and balanced reporting. By following our Editorial Policy, our writers verify every source, fact-check each story, rely on reputable sources, and attribute quotes and media correctly. We also follow a rigorous Review Methodology when evaluating exchanges and tools. From emerging blockchain projects and coin launches to industry events and technical developments, we cover all facets of the digital asset space with unwavering commitment to timely, relevant information.