Sandbox Coin May Rise 6% In Coming Week; But Here’s A Catch


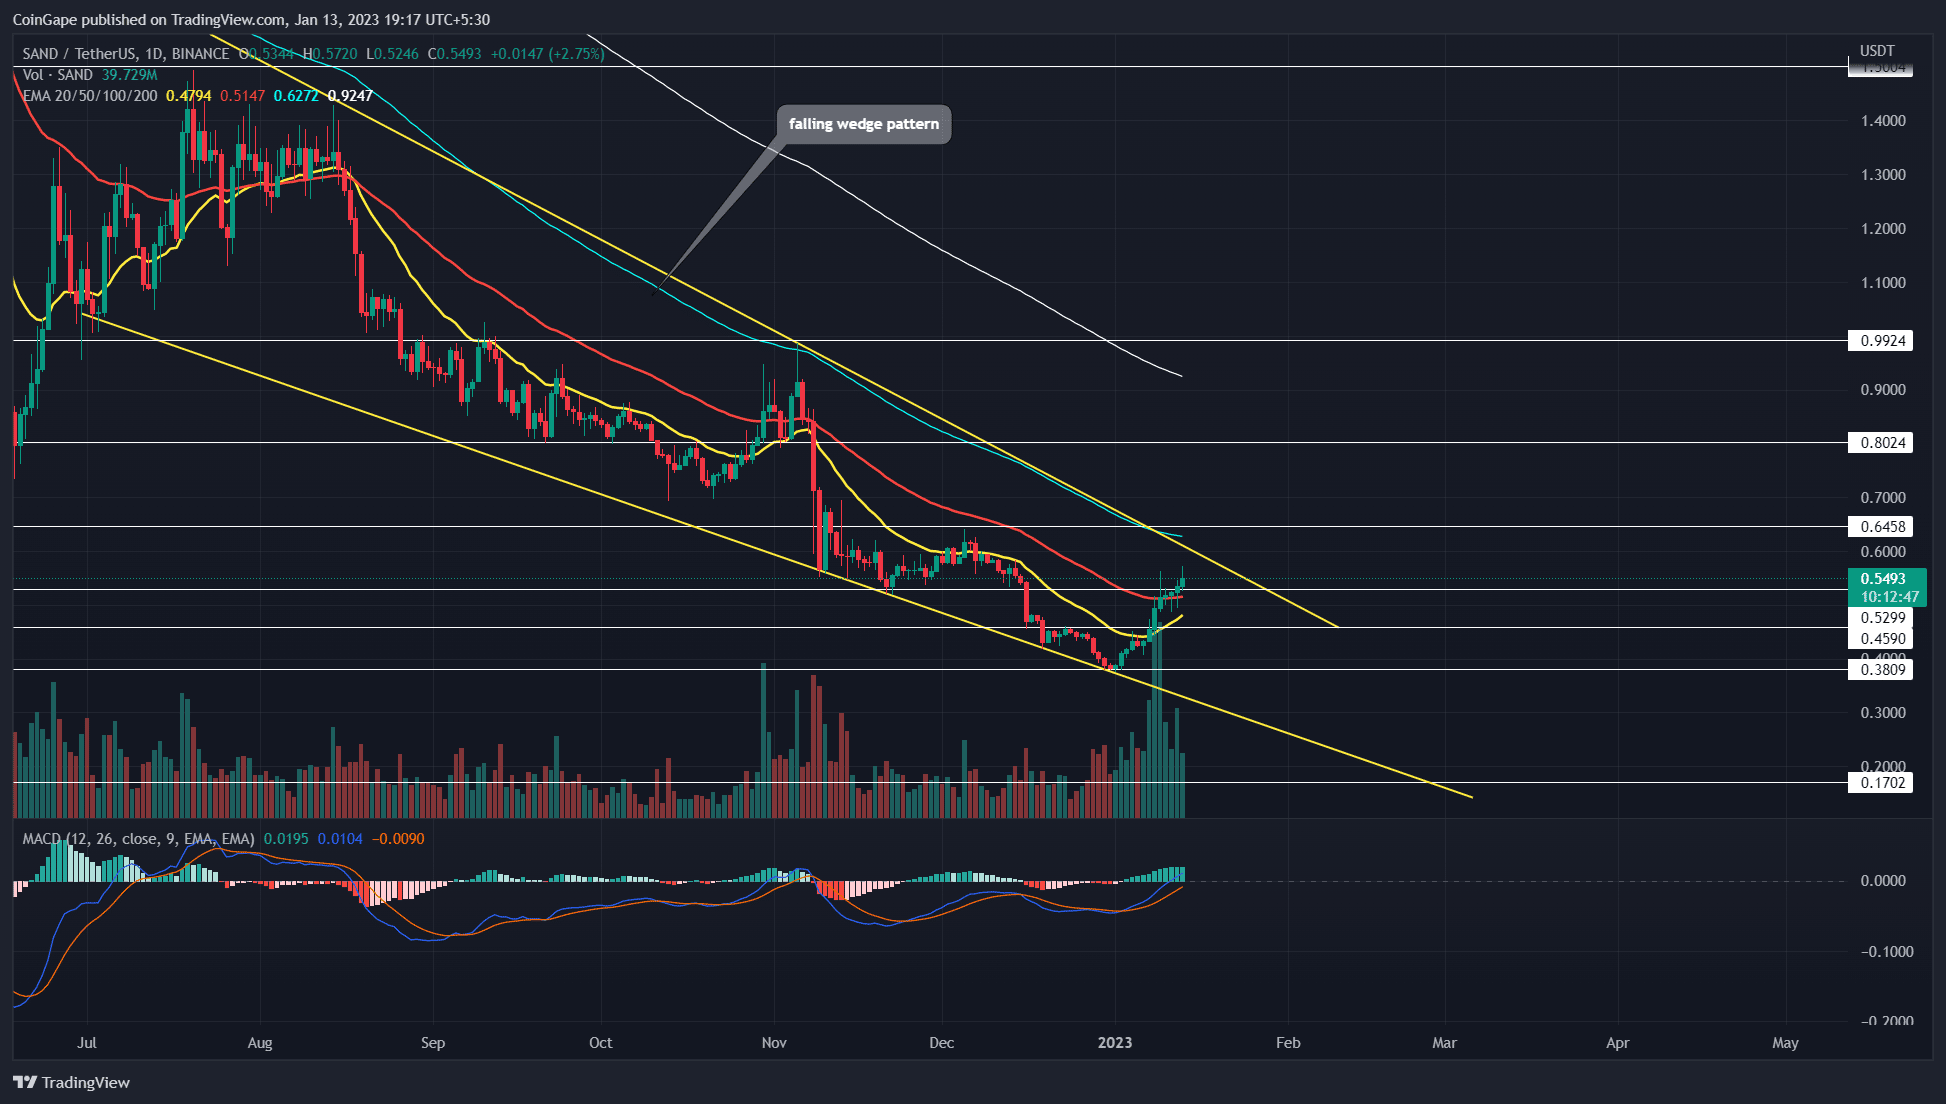
The metaverse tokens have significantly benefited from the recent new recovery in the crypto market. The tokens associated with the technology have shown a significant jump in the last two weeks. As a result the sandbox price rebounded from the $0.377 mark and surged 47% higher to reach the current price of $0.552.
Key points:
- The higher price rejection in today’s daily candle reflects active selling pressure near $0.57
- an upward the record from overhead and then and will unless in the police Momentum of sandbox coin
- The intraday trading volume in SAND price is $409.6 Million, indicating a 10% loss.
 Source-tradingview
Amid the recent recovery in the market, the Sandbox price bounced back from the combined support of $0.45 and support trendline of a falling channel pattern. This V-shaped recovery accentuates aggressive buying in the market, which recently breached multiple resistance levels, such as $0.43, $0.56, and downsloping EMAs(20 and 50).
Moreover, with sustained buying pressure, the SAND price may rise another 6% before hitting the patterns resistance trendline. However, the daily chart shows the prices have rejected this resistance twice in the past six months, indicating the traders are actively selling on the bullish upswings.
Also Read: Top 10 DeFi Lending Platforms In 2023
Moreover, the decreasing volume in the daily candles of the past few days reflects the exhausted bullish momentum. Therefore, If the selling pressure persists near the trendline the SAND price is likely to revert from this dynamic resistance.
In an ideal bearish condition, a reversal from the patterns resistance trendline usually dumps the prices back to the support trendline.
On a country note, the following wedge pattern is a famous bullish continuation pattern that provides a strong rally upon the break out of its resistance trendline. Thus, if the market sentiment remains positive, the SAND price may find support at the breached resistance mentioned above.
Lastly, a bulls breakout from the overhead tendency will offer a long entry opportunity for interested investors.
Technical indicator
MACD: a sufficient gap between the bullish alignment of MACD and signal line indicates steady recovery for SAND price. Moreover, the long traders would get additional confirmation for price recovery if these slopes breach their midline along with the aforementioned trendline breakout.
EMA’s: the 100-day EMA aligned with the patterns resistance trendline increases the resistance power against potential rally.
Sandbox coin price intraday levels
- Spot price: $0.55
- Trend: Bullish
- Volatility: Low
- Resistance level- $0.63 and $0.71
- Support level- $0.46 and $0.37


- Uniswap Launches UNIfication to Overhaul Governance Model: Report
- Vivek Ramaswamy’s Strive Acquires $162M in Bitcoin, Surpasses Galaxy Digital in BTC Holdings
- Bitcoin News: BTC Exchange Reserves Fall as Tether Mints $1B USDT
- Breaking: U.S. Treasury And IRS Issue New Guidance For Crypto ETFs To Stake Digital Assets
- Fed’s Stephen Miran Says a 50 bps December Rate Cut Is ‘Appropriate’
- HBAR Price Prediction: Analyst Eyes 90% Surge Amid Taker Buy Dominance
- Expert Predicts 200% Shiba Inu Price Surge as Open Interest, Burn Rate Spikes
- Solana Price Eyes $200 This Week as Spot ETFs Lead $137M Inflows
- Pi Network: What’s Keeping Pi Coin Price $0.30 Below?
- What to Expect from Dogecoin, Shiba Inu, Bitfrac and Cardano Prices Now?
- After a 7% Pump, Will FUNToken Continue to Keep the Momentum?


Why Trust CoinGape
CoinGape has covered the cryptocurrency industry since 2017, aiming to provide informative insights Read more…to our readers. Our journal analysts bring years of experience in market analysis and blockchain technology to ensure factual accuracy and balanced reporting. By following our Editorial Policy, our writers verify every source, fact-check each story, rely on reputable sources, and attribute quotes and media correctly. We also follow a rigorous Review Methodology when evaluating exchanges and tools. From emerging blockchain projects and coin launches to industry events and technical developments, we cover all facets of the digital asset space with unwavering commitment to timely, relevant information.
Premium Partners