Cryptocurrency Prices Today: Bitcoin Holds $25500, Solana and Synthetix Coins See Rally


Despite the recent market volatility, Bitcoin(BTC) has found reliable support at $25500. Over the past three weeks, even amidst the crypto market’s unpredictability, this coin price has bounced back from the bottom creating a sense of reversal to major altcoins.
As of 5:51 a.m. on Saturday, the global cryptocurrency market capitalization is at $1.04 trillion, projecting a 0.63% drop since yesterday. Moreover, the market has seen a drop in trading volume to 34.28% Billion registering a 9.89% loss in the last 24 hours.
Also Read: Bitcoin (BTC) Price Stalls as US Dollar Hits 8th Weekly Gain, Calls for Concern?
Bitcoin Price Analysis: Double Bottom Pattern Sets $BTC Rally to $31000
 Source- Tradingview
During the latest market downturn, Bitcoin price recovery hit a roadblock at $28176, leading to a 9.5% decline that revisited the local support of $25500. Although the recovery effort wasn’t successful, the persistent defense of the aforementioned level mark and the lower trendline underscores their importance in influencing the near future trend.
Multiple lower-price rejection candles at $25000 indicate the buyers’ active accumulation at a discounted price. If the bullish momentum persists, a potential swing will shape a bullish reversal pattern called a double bottom.
In response to this setup, the BTC price can rally back to $31000.
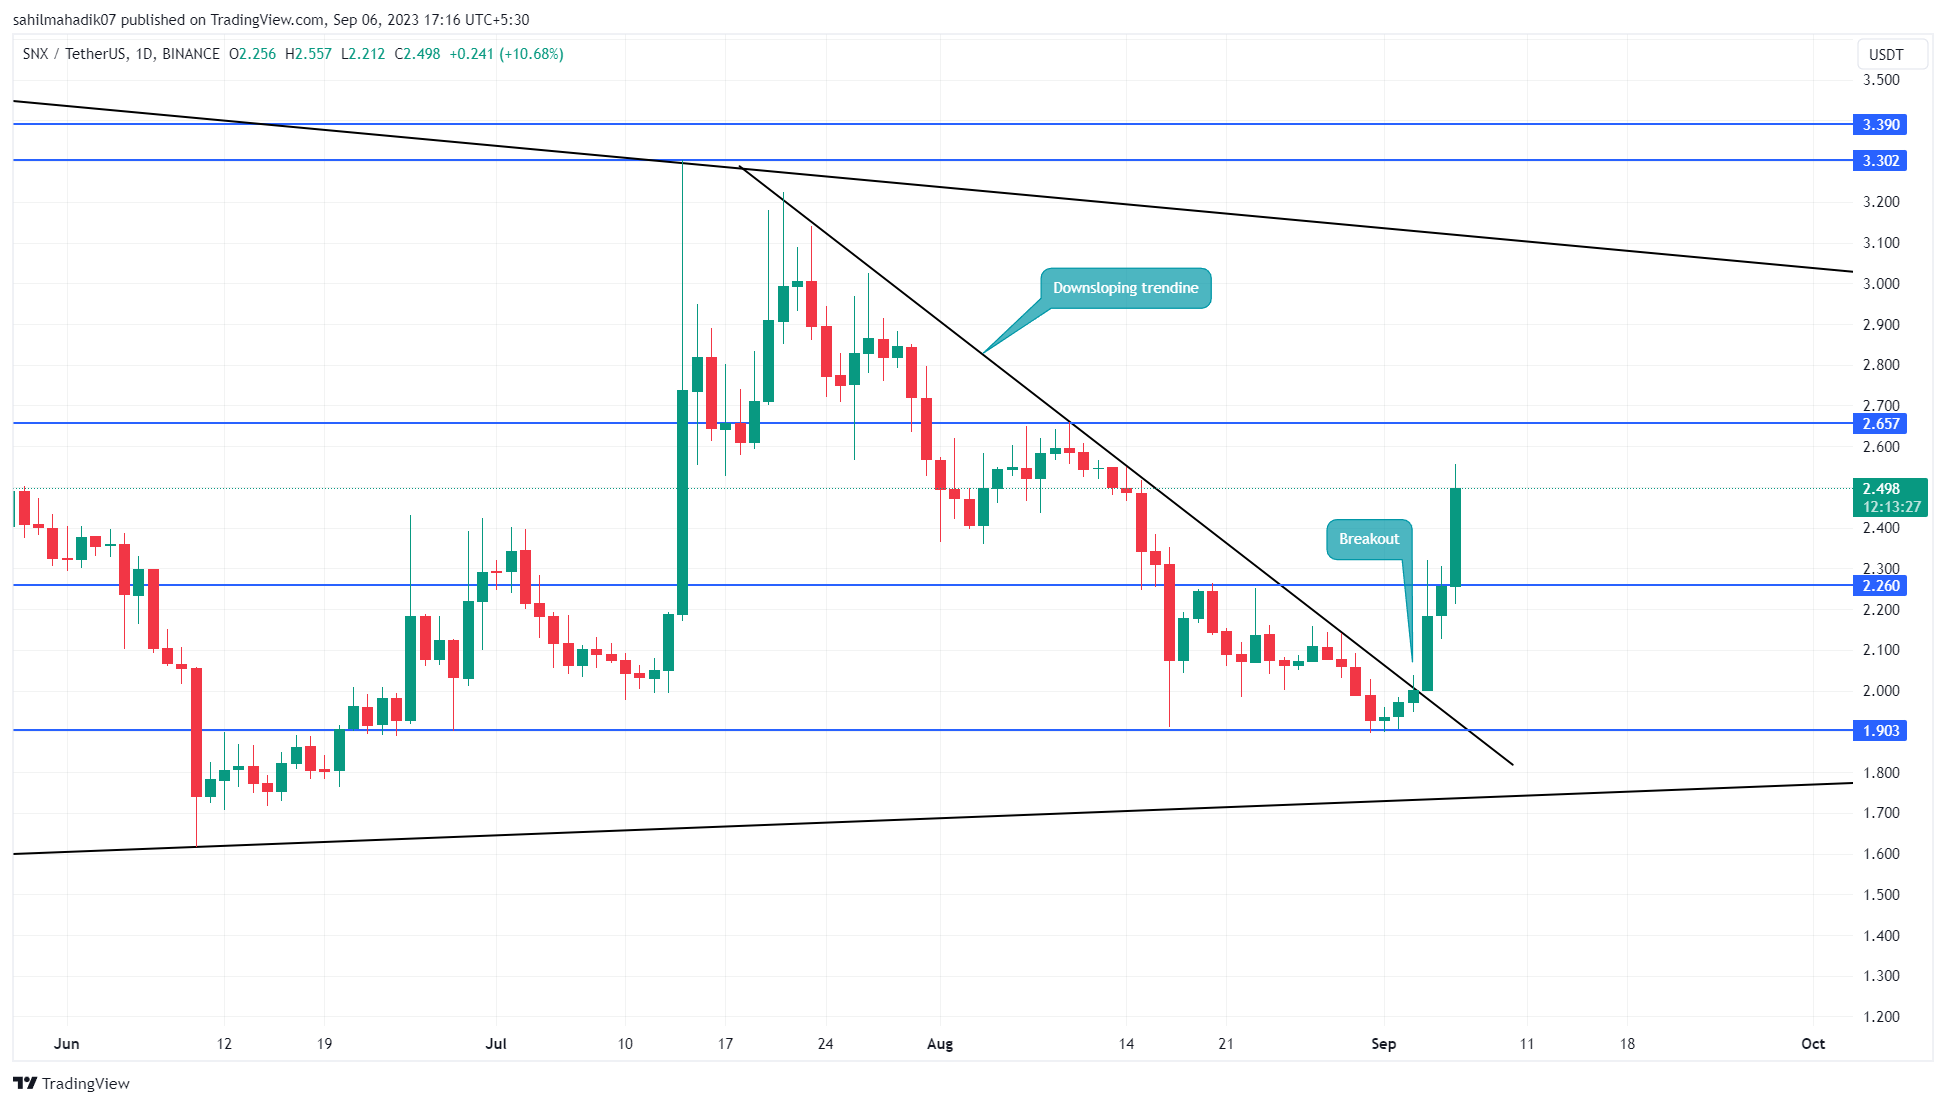
Synthetix Price Analysis: Trendline Breakout Triggers a Directional Rally
 Source- Tradingview
On September 4th, the Synthetix price gave a massive breakout from the downsloping trendline. Breaking above the barrier carried a correction of nearly six weeks signaling the potential for a significant upswing.
The SNX price rose for six consecutive days, registering a 31.3% gain to reach $2.499. The coin price may see a major pullback to recuperate bullish momentum, while the potential rally may reach $2.65, followed by $3.3
Solana Price Analysis: Wedge Pattern Hints Potential Trend Change
Source- Tradingview
In the daily chart, the Solana price displays the formation of a falling wedge pattern, characterized by a steady narrowing between two converging trend lines. As long as this fall persists, there’s a potential for the price to further decline toward the significant $17 threshold.
However, in theory, this ending diagonal pattern hints at the weakening bearish momentum and the possibility of a trend reversal. a bullish breakout above the upper trendline will potentially propel the price back toward the $30 range.


- Fed’s Stephen Miran Calls for Rapid Rate Cuts Amid U.S.-China Trade Tensions
- Peter Thiel-Backed Crypto Bank Erebor Gets OCC Greenlight as Ripple, Circle Await Charter Decisions
- Fed Chair Shortlist Now Down to Five Candidates, Scott Bessent Confirms
- Bitwise CIO Calls Crypto Crash a ‘Blip’ as Market Bounces Back With $338M ETF Inflows
- XRP News: Ripple Strikes Deal with Absa, Expanding Custody Footprint To Africa
- Cardano Price Teeters as Whales Exit and Bearish Signal Emerges
- Sui Price Targets $9.5 as Figure Brings SEC-Approved Yield Token YLDS to Sui
- Chainlink Price Eyes $100 as S&P Global Partnership Expands Institutional Adoption
- Solana Price Prediction as Whales Withdraw $169M from Exchanges
- Pro Says Ethereum Price is a Buy Despite Rising Liquidations and BlackRock Selling
- XRP Price Prediction as Whales Dump 2.23B Tokens — Is $2 the Next Stop?


Why Trust CoinGape
CoinGape has covered the cryptocurrency industry since 2017, aiming to provide informative insights Read more…to our readers. Our journal analysts bring years of experience in market analysis and blockchain technology to ensure factual accuracy and balanced reporting. By following our Editorial Policy, our writers verify every source, fact-check each story, rely on reputable sources, and attribute quotes and media correctly. We also follow a rigorous Review Methodology when evaluating exchanges and tools. From emerging blockchain projects and coin launches to industry events and technical developments, we cover all facets of the digital asset space with unwavering commitment to timely, relevant information.