

Aptos Price Prediction as Buyers Break 200 Days Resistance; Will they Reclaim $8?


Contrary to the recent downturn in the crypto market, the APT price has witnessed a significant inflow since last weekend. The coin price rose for four consecutive days, has recorded a 12% gain, and challenges the long-coming price and timeline. A potential breakout from this barrier would be a key signal of sustained recovery.
Also Read: Central American Country Uses Bitcoin To Conduct Fair Election; Here’s How
Will its New Found Recovery Continue?
- The APT price faces dynamic resistance from a falling trendline.
- A potential bullish breakout from the overhead trendline will be an early sign of trend reversal
- The intraday trading volume in APTer is $343.2 Billion, indicating a 20% gain
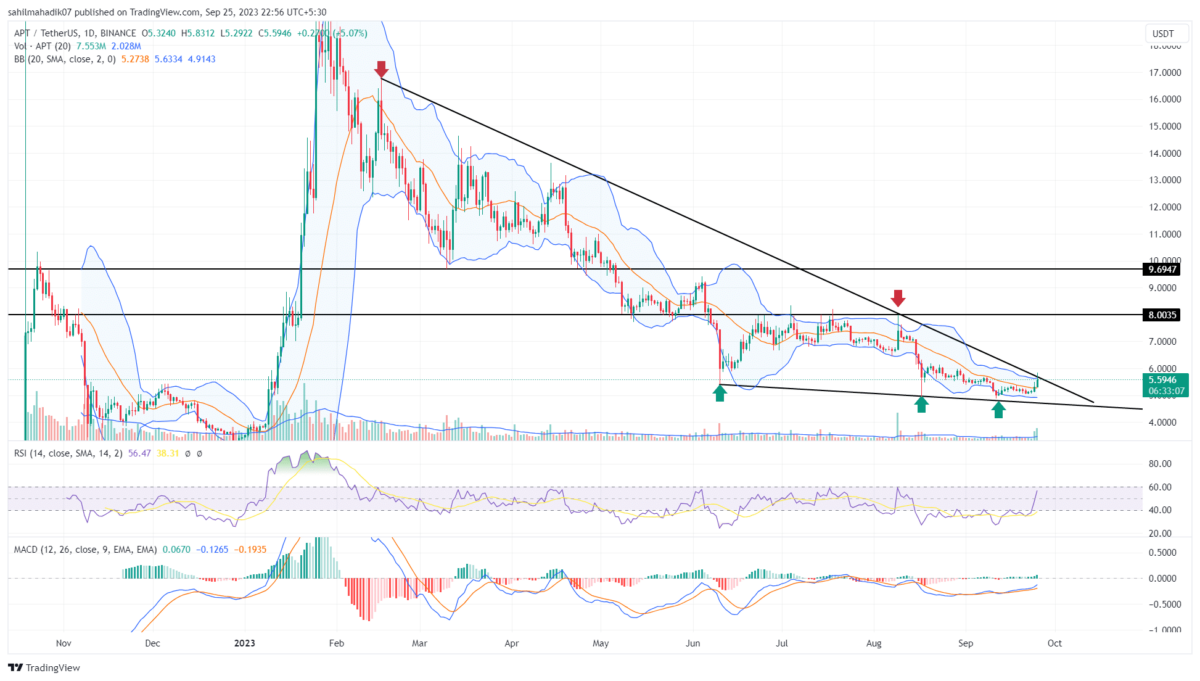
 Source- Tradingview
Since February 2023, the Aptos coin price has experienced a significant correction, registering a 73% loss from its all-time high of $19.9. However, the daily chart shows the coin price has started molding between converging trend lines, acting as dynamic resistance and support.
With the recent uptick in APT price, the buyers knock on the door of the upper trendline—a barrier that’s held firm for nearly 200 days. However, the visible price rejection on the day’s candle might indicate that sellers are still guarding this fortress. If they maintain their stance, this altcoin might retract and trigger a new bear cycle within the wedge formation of trendlines.
The potential decline may plunge the prices 18% down to hit the lower trendline.
Will Aptos Rise to $8?
Until the two trendlines are intact, the Aptos coin rise may continue their ongoing downtrend. However, the converging nature of this trend line would eventually lead to a decisive breakout. If we lean on the side of optimism, a bullish breakout from the upper trend line could pave the way for buyers to regain control, ushering in a fresh rally. The post-breakout rally could surge the price of the $8 psychological barrier.
- Bollinger Band: The narrow range of Bollinger Band indicates increasing volatility and an imminent breakout is close.
- Moving Average Convergence Divergence: A potential crossover of the MACD(Blue) and signal lines(orange) above the midline could bolster the buying pressure.
- Relative Strength Index: The daily RSI slope rising above 50% reflects the increasing bullish momentum among traders.

Why Trust CoinGape
CoinGape has covered the cryptocurrency industry since 2017, aiming to provide informative insights Read more…to our readers. Our journal analysts bring years of experience in market analysis and blockchain technology to ensure factual accuracy and balanced reporting. By following our Editorial Policy, our writers verify every source, fact-check each story, rely on reputable sources, and attribute quotes and media correctly. We also follow a rigorous Review Methodology when evaluating exchanges and tools. From emerging blockchain projects and coin launches to industry events and technical developments, we cover all facets of the digital asset space with unwavering commitment to timely, relevant information.
Premium Partners


Related Articles


- Michael Saylor’s “Green Dots” Message Hints At Fresh Bitcoin Buying As BTC Faces $90K Wall
- Fed’s Hammack Signals No Rush to Cut Rates as January Hold Odds Near 80%
- XRP ETFs Reach $1.21B as Asset Managers See a ‘Third Path’ Beyond Bitcoin
- Nearly $50M in USDT Stolen After Address Poisoning Scam Targets Crypto Trader Wallet
- Breaking: Rep. Max Miller Unveils Crypto Tax Bill, Includes De Minimis Rules for Stablecoins
- Will Solana Price Hit $150 as Mangocueticals Partners With Cube Group on $100M SOL Treasury?
- SUI Price Forecast After Bitwise Filed for SUI ETF With U.S. SEC – Is $3 Next?
- Bitcoin Price Alarming Pattern Points to a Dip to $80k as $2.7b Options Expires Today
- Dogecoin Price Prediction Points to $0.20 Rebound as Coinbase Launches Regulated DOGE Futures
- Pi Coin Price Prediction as Expert Warns Bitcoin May Hit $70k After BoJ Rate Hike
- Cardano Price Outlook: Will the NIGHT Token Demand Surge Trigger a Rebound?


